Partners


Momentum for a low-carbon economy is building, but much more needs to be done. International partnerships can help catalyse the economic growth and emissions reduction to get us there.
The Global Commission makes 10 key recommendations in which partnerships can help deliver better growth and a better climate.
The world is changing before our eyes. As discussed in Better Growth, Better Climate, new patterns of international production and trade, demographic change and technological advances have dramatically altered the shape of the global economy over the last two decades. “Business as usual” is thus no longer an option. Structural change is inevitable – but that change can be steered to make economies at all levels of development stronger, more equitable, more sustainable and more resilient.
Several emerging trends and developments offer new opportunities to accelerate the transition to low-carbon growth and prosperity. In this section we highlight six: rapid innovation and declining costs of clean energy technologies; the fall in oil prices as an opportunity to advance carbon pricing and fossil fuel subsidy reform; growing international attention to infrastructure investment, particularly in the context of low interest rates; heightened awareness of climate risks in the financial sector; rising interest in low-carbon growth pathways in emerging and developing economies; and an acceleration of the decline in the carbon intensity of the global economy.
This is a time of huge opportunity. In the second half of 2015, world leaders will agree on new Sustainable Development Goals and how to finance them, and negotiate a comprehensive new climate change treaty. Technology is advancing rapidly, redefining what is possible. New economic trends and opportunities, combined with new leadership commitments, have built real momentum for change. This was already evident when the Global Commission published Better Growth, Better Climate last year; it has kept growing since.
A goal once seen as distant – to end extreme poverty, achieve broad-based prosperity and secure a safe climate together – is increasingly within reach. More and more governments, businesses and communities are actively pursuing it. But significant challenges and obstacles still stand in the way.
This report focuses on how international and multi-stakeholder cooperation can accelerate progress and help overcome key barriers. Such cooperation can take many different forms: it includes partnerships between governments, but also among businesses, investors, states and regions, city and local authorities, international organisations, civil society organisations and communities. Over the last few years many such partnerships have emerged. This report identifies some of the most promising ones and suggests ways to scale them up further. It also identifies areas where new initiatives are needed. As such, it provides a menu of options for different actors to contribute to delivering both economic and climate outcomes.
Better Growth, Better Climate showed how countries at different levels of development can achieve stronger economic growth, reduce poverty, advance development goals, and reduce climate risk at the same time. It focused on the three major economic systems where growth and emissions are concentrated – cities, land use and energy – and called for consistent and credible policies around three key drivers of change – resource efficiency, infrastructure and innovation (see Box 1). It showed that the economic and social benefits alone would make many low-carbon policies and approaches worth pursuing. But it also recognised that the challenges that countries face in tackling these issues are deeply shaped by their history and their political and economic circumstances. Low-income countries in particular need robust international support to make progress on these fronts – and some actions are difficult for any country to take on alone.
This is why international cooperation is so crucial. It is a key lever to strengthen and more effectively distribute the flow of new ideas and technical capacity. It can mobilise and scale up finance, particularly to developing economies. It can help overcome concerns about loss of competitiveness, reduce trade barriers and increase the scale of markets. By working together, countries, businesses, cities and others can move faster and achieve greater gains.
Further international and multi-stakeholder cooperation could also significantly enhance and complement the ambition of countries’ commitments under the expected new climate agreement. The pledges made to date (“intended nationally determined contributions”, or INDCs) are important steps forward, but it is now clear that they are unlikely to add up to a level of emissions reduction consistent with keeping global warming under the internationally agreed limit of 2°C. The INDCs are therefore just a starting point; to avoid even more severe impacts on human well-being and economic growth than are already expected, ambition will need to rise steadily over the next 10–15 years. Cooperative action can make that easier and more cost-effective.
Part 1 of this report outlines some of the major emerging developments and trends which are creating new opportunities to achieve stronger growth and climate action together, as well as continuing challenges. It then looks at how stronger international and multi-stakeholder cooperation can advance and accelerate progress and help tip the balance towards low-carbon global growth. It discusses these different forms of cooperation, and places them in the context of the international climate negotiations. Part 2 then explores 10 areas where there are large, immediate opportunities to galvanise such partnerships, summarising in-depth analyses set out in a series of Working Papers which will accompany the report.
The international meetings taking place in the remainder of 2015 – in particular the International Conference on Financing for Development in Addis Ababa in July, the UN Summit to adopt the post-2015 Sustainable Development Goals in New York in September, the G20 Summit in Antalya in November, and the Paris Climate Change Conference (COP21) in December – are critical moments for the international community. The world’s leaders must rise to the challenge. Failure to seize these opportunities would set back the cause of development and poverty reduction for years. But success could unleash a new era of international cooperation for better growth and a better climate. The Commission hopes this report can contribute to that success.
The Global Commission on the Economy and Climate’s 2014 report, Better Growth, Better Climate, is addressed to economic decision-makers across the world, in both the public and private sectors. It examines the large structural and technological changes already occurring in the global economy, and shows that through targeted policies and investments, countries at all levels of development can build stronger economies while substantially reducing climate risk.
A key insight of the report is that many of the policy and institutional reforms needed to tackle climate risk are also crucial for revitalising growth, fostering development and improving well-being. The opportunities for such reforms are increasing, as emerging and developing economies experience rapid urbanisation and structural change, innovation reduces the cost of a low-carbon transition, and the costs of the current economic growth model become more apparent. Many reforms can generate multiple economic, social and environmental benefits: improved economic performance and faster poverty reduction, as well as cleaner air, more liveable and vibrant cities, and greater resilience to climate change.
The report examines three key drivers of change: efficiency of resource use, infrastructure investment, and innovation. All three offer potential for both improving growth and reducing climate risk. Progress will be especially important in three key socio-economic systems that underpin a large share of the world’s economic activity and greenhouse gas (GHG) emissions: cities, land use, and energy. Credible and consistent policies are needed in each, taking into account the unique circumstances, varying capacities and differing needs of countries at different levels of development.
Cities and urban areas are home to half the world’s population, and account for about 80% of global economic output and around 70% of global energy use and energy-related GHG emissions. Nearly all of the world’s population growth in the next two decades will occur in urban areas, primarily in developing countries; by 2050, two-thirds of the global population will be urban. How cities develop is thus critical to the future path of the world economy, development and climate. A large share of urban growth today involves unmanaged sprawl, leading to congestion, rising air pollution, and high economic, social and environmental costs overall. As discussed in Section 2.1, pioneering cities around the world are demonstrating the benefits of a different approach: more compact, connected and coordinated urban forms built around mass transit. Adopting this model not only leads to more attractive and competitive cities, but higher quality of life, sustained resource savings and lower GHG emissions.
Land use is a key development concern, as roughly a quarter of the world’s agricultural land is severely degraded, and forests continue to be cleared for conversion to crops and pasture, and for timber and mining. Key ecosystem services are being compromised, and the natural resource base is becoming less productive. Yet by 2050, the world’s farms will need to produce 70% more calories than in 2006, due to population growth, rising incomes and changing diets. There is considerable scope to increase agricultural productivity and resilience through new methods of crop and livestock management and the restoration of degraded land, and at the same time to reduce the estimated 25% of food that is wasted globally. Better Growth, Better Climate recommends international cooperation to restore 500 million hectares of degraded forests and agricultural land through scaled-up investment and adoption of landscape-level approaches. It also recommends a scale-up of programmes to protect and restore forests, including reaching at least a US$5 billion investment in REDD+ financing per year. Section 2.2 highlights recent initiatives that can help to deliver this.
Energy use has grown by more than 50% since 1990. Energy services will need to keep rising rapidly to support continued development and bring modern energy access to the 1.3 billion people who lack access to electricity and the 2.7 billion who lack modern cooking facilities, mostly in sub-Saharan Africa and South Asia. Energy production and use already account for two-thirds of global GHG emissions, so how this new demand is met is a crucial determinant of climate risk. Better Growth, Better Climate stresses the need to sharply boost energy efficiency, encouraging governments to treat it as the “first fuel” – a topic discussed further in Section 2.4. It also urges an expansion of low-carbon energy production, particularly renewables, noting their falling costs and the benefits to energy security, air quality and public health. And it calls for an end to new unabated fossil fuel power: in developed countries immediately, and in emerging economies by 2025, while acknowledging the specific needs of lower-income countries. Energy markets and financing methods also need to be adapted to accommodate renewables at scale; this is discussed in Section 2.3.
Cutting across and shaping these three socio-economic systems are three major drivers of change:
Resource efficiency is essential for achieving both better growth and emissions reduction. There are numerous opportunities to boost efficiency in the use of energy, water, land, capital and other crucial resources through reforms to tackle market failures and poor policies. Better Growth, Better Climate recommends that governments introduce strong, predictable and rising carbon prices as part of fiscal reform strategies, prioritising the use of the revenues to offset impacts on low-income households or to finance reductions in other, distortionary taxes. Effective policies will need to be tailored to each country’s circumstances. As discussed in Section 2.5, there has been considerable momentum towards both carbon pricing and fossil fuel subsidy reform in the last two years. In rural areas water, fertiliser and power subsidy reforms are likewise needed to encourage more efficient and sustainable agricultural practices.
Infrastructure investment – in transport networks, power plants and transmission systems, buildings, water and telecommunication systems – is a crucial driver of development, providing critical services and raising the overall productivity of the economy. The nature of infrastructure investment will also determine to a great extent whether economies can shift to a low-carbon path or are locked into high levels of fossil fuel use and inefficient, sprawling cities. The global economy will require about US$90 trillion in infrastructure investments by 2030 across cities, land use and energy systems, especially in developing countries. A low-carbon transition will require a shift in the allocation of this investment, with perhaps a 5% increase in upfront capital needs – about US$270 billion per year. These higher capital costs could potentially be fully offset by lower operating costs, such as from reduced expenditure on fuel. Section 2.6 examines how infrastructure planning can be made both more resilient to climate impacts and compatible with climate mitigation goals.
Innovation is central to economic growth and productivity. Innovation, and the rapid diffusion of clean technologies between countries, is also essential to achieve low-carbon development models, making it possible to continue economic growth in a world of finite resources. Advances in materials science, digitisation, the circular economy and business models are now reshaping industrial production, and creating opportunities for developing countries to “leapfrog” over less efficient, more polluting stages of development. Better Growth, Better Climate argues that public support for energy research and development (R&D) should be at least tripled in major economies by the mid-2020s, to well over US$100 billion per year. It also encourages the use of pricing mechanisms, regulatory standards and public procurement to create market “pull” for low-carbon technologies. Section 2.7 highlights key areas where international partnerships to share costs and knowledge could greatly enhance national efforts, particularly to support growth and emissions reduction in emerging and developing countries.
By pursuing these approaches, Better Growth, Better Climate argues that economic growth, development and climate outcomes can be achieved at the same time: countries need not choose between them. The multiple benefits of climate action include reductions in the health impacts of air pollution, in traffic congestion and accidents; lower risk of locking-in stranded assets; less vulnerability to volatile fossil fuel prices and potential fuel supply disruptions; enhanced productivity of agricultural and forested lands, and associated increases in rural income; as well as the benefits of reduced climate impacts. In terms of air pollution, for example, fossil fuel-related emissions lead to an estimated 3.7 million premature deaths globally each year, with millions more suffering from respiratory illnesses.
Yet Better Growth, Better Climate also stresses that shifting to a low-carbon, climate-resilient economic pathway will not be easy, and will entail additional investment in the short term. Not all climate policies are win-win, and some sectors and businesses will lose out, even where there are overall net gains to the economy. Governments will need to commit to a “just transition”, providing support for displaced workers, affected communities, and low-income households. And the mix of policies used will need to be adjusted to suit different country circumstances. Strong political leadership and the active engagement of civil society and business will be crucial. Broad international cooperation is also vital, particularly to support developing countries in moving towards a lower-carbon and more climate-resilient growth model. A new international climate agreement, including robust financial commitments, is essential to lay a strong foundation for ambitious action in countries at all levels of development.
The world is changing before our eyes. As discussed in Better Growth, Better Climate, new patterns of international production and trade, demographic change and technological advances have dramatically altered the shape of the global economy over the last two decades. “Business as usual” is thus no longer an option. Structural change is inevitable – but that change can be steered to make economies at all levels of development stronger, more equitable, more sustainable and more resilient.
Several emerging trends and developments offer new opportunities to accelerate the transition to low-carbon growth and prosperity. In this section we highlight six: rapid innovation and declining costs of clean energy technologies; the fall in oil prices as an opportunity to advance carbon pricing and fossil fuel subsidy reform; growing international attention to infrastructure investment, particularly in the context of low interest rates; heightened awareness of climate risks in the financial sector; rising interest in low-carbon growth pathways in emerging and developing economies; and an acceleration of the decline in the carbon intensity of the global economy.
These trends and developments are happening at all levels, from the global, to the regional and to the local. They are being spurred by leading companies, major cities and enlightened governments. None is decisive in itself, and in each case, major barriers and challenges still need to be overcome to achieve large-scale and lasting change. But as discussed in Section 1.2, international and multi-stakeholder cooperation can play a key role in helping overcome these challenges.
In November 2014, a new price benchmark for solar photovoltaics (PV) was set in Dubai: a bid of just under US$60 per MWh in response to a tender from the state utility DEWA.1 While these are record lows, the cost of solar power systems globally has fallen by 75% since 2000, while that of energy storage has fallen by 60% since 2005 alone. In a wide range of geographies, utility-scale solar PV is being procured for about US$80/MWh.2 This corresponds to natural gas prices in the range of US$7–10 mmbtu – still higher than the US$2–3/mmbtu seen in the shale-rich US in early 2015, but lower than the US$9–10/mmbtu prevailing in Germany and US$14–15 mmbtu in Japan.3 This means that in an ever-growing number of countries, solar PV is now competitive with fossil fuels. A similar story can be told for wind power.4
As a result of these falling costs, every dollar invested in renewables buys more capacity than ever: the US$270 billion invested in 2014 bought 36% more capacity than the US$279 billion invested in 2011.5Experts predict that a further rise in the competitiveness of renewable energy is now only a few years away as a result of plunging energy storage costs. The recent emergence of advanced low-cost batteries for homes, industry and utilities,6along with the rapid development of smart systems using digital and information technologies, is enabling the sophisticated management of demand at every level from the grid as a whole to individual homes. Radical new energy business models are now in prospect, with the potential to lead to a step-change in overall energy productivity.7
One result of these trends is that the share of new renewables (excluding hydropower) in electricity generation worldwide is rising – from 8.5% in 2013 to 9.1% in 2014, when renewables contributed 48% of the world’s newly-added generating capacity (see Figure 1).8It is still not enough, but almost everywhere in the world renewable investment is growing rapidly.
Yet investment in fossil fuels also continues: in 2014, more than 1,300 GW of coal-fired capacity was in construction or pre-construction stages around the world, and major investments are being made in new sources of oil and gas.9At the current rate of increase of about 0.6–0.7 percentage points a year, the share of renewables in total electricity generation would still only reach 20% by 2030 – considerably less than the 41% which the IEA suggests is needed to hold global warming to under 2°C.10The speed of change is inhibited by several factors: continuing challenges raising the financing needed to invest in renewables; the difficulty of reforming energy markets and regulatory arrangements to enable the integration of intermittent renewables into electricity systems at scale; and continuing fossil fuel subsidies and weak or absent carbon prices, which keep fossil fuel energy prices artificially low. But in turn these challenges are spurring new efforts at overcoming them, in both national policymaking in many countries and through various forms of international cooperation. We discuss these below and in Part 2.3.

Figure 1. Annual additions to global power generation capacity (GW)
Source: Liebreich, M., 2015.11
Global oil prices fell by half between the middle and end of 2014 (Figure 2). At first sight, this might not seem like an opportunity for lower-carbon growth. In fact, it has raised demand for oil and gas to some extent. However, lower oil prices have also created an opportunity to pursue much-needed policy reforms. Low prices make it easier in particular for governments to reform fossil fuel consumption subsidies and adopt more efficient frameworks for energy taxation, while still keeping fuel prices affordable.
It is unclear how long this opportunity will last. There are multiple causes for the recent fall in prices, including the growth in unconventional sources such as shale oil, sluggish world demand, changes in the Organization of the Petroleum Exporting Countries (OPEC) price determination policy and a stronger US dollar. Empirical analysis suggests that supply factors played the biggest part in the recent price drop.12 Modelling suggests that the oil price decline may increase global GDP by 0.3–0.7% in 2015, and by 0.2–0.8% in 2016.13 However, there is little consensus on the medium-term direction of oil prices, and price predictions are in any case frequently inaccurate. What can be said is that large swings in the oil price of 25–50% over a short period are quite common, and such volatility is likely to continue. Volatility and the increased uncertainty it brings are economically harmful in their own right, delaying business investment and requiring costly reallocation of resources.14
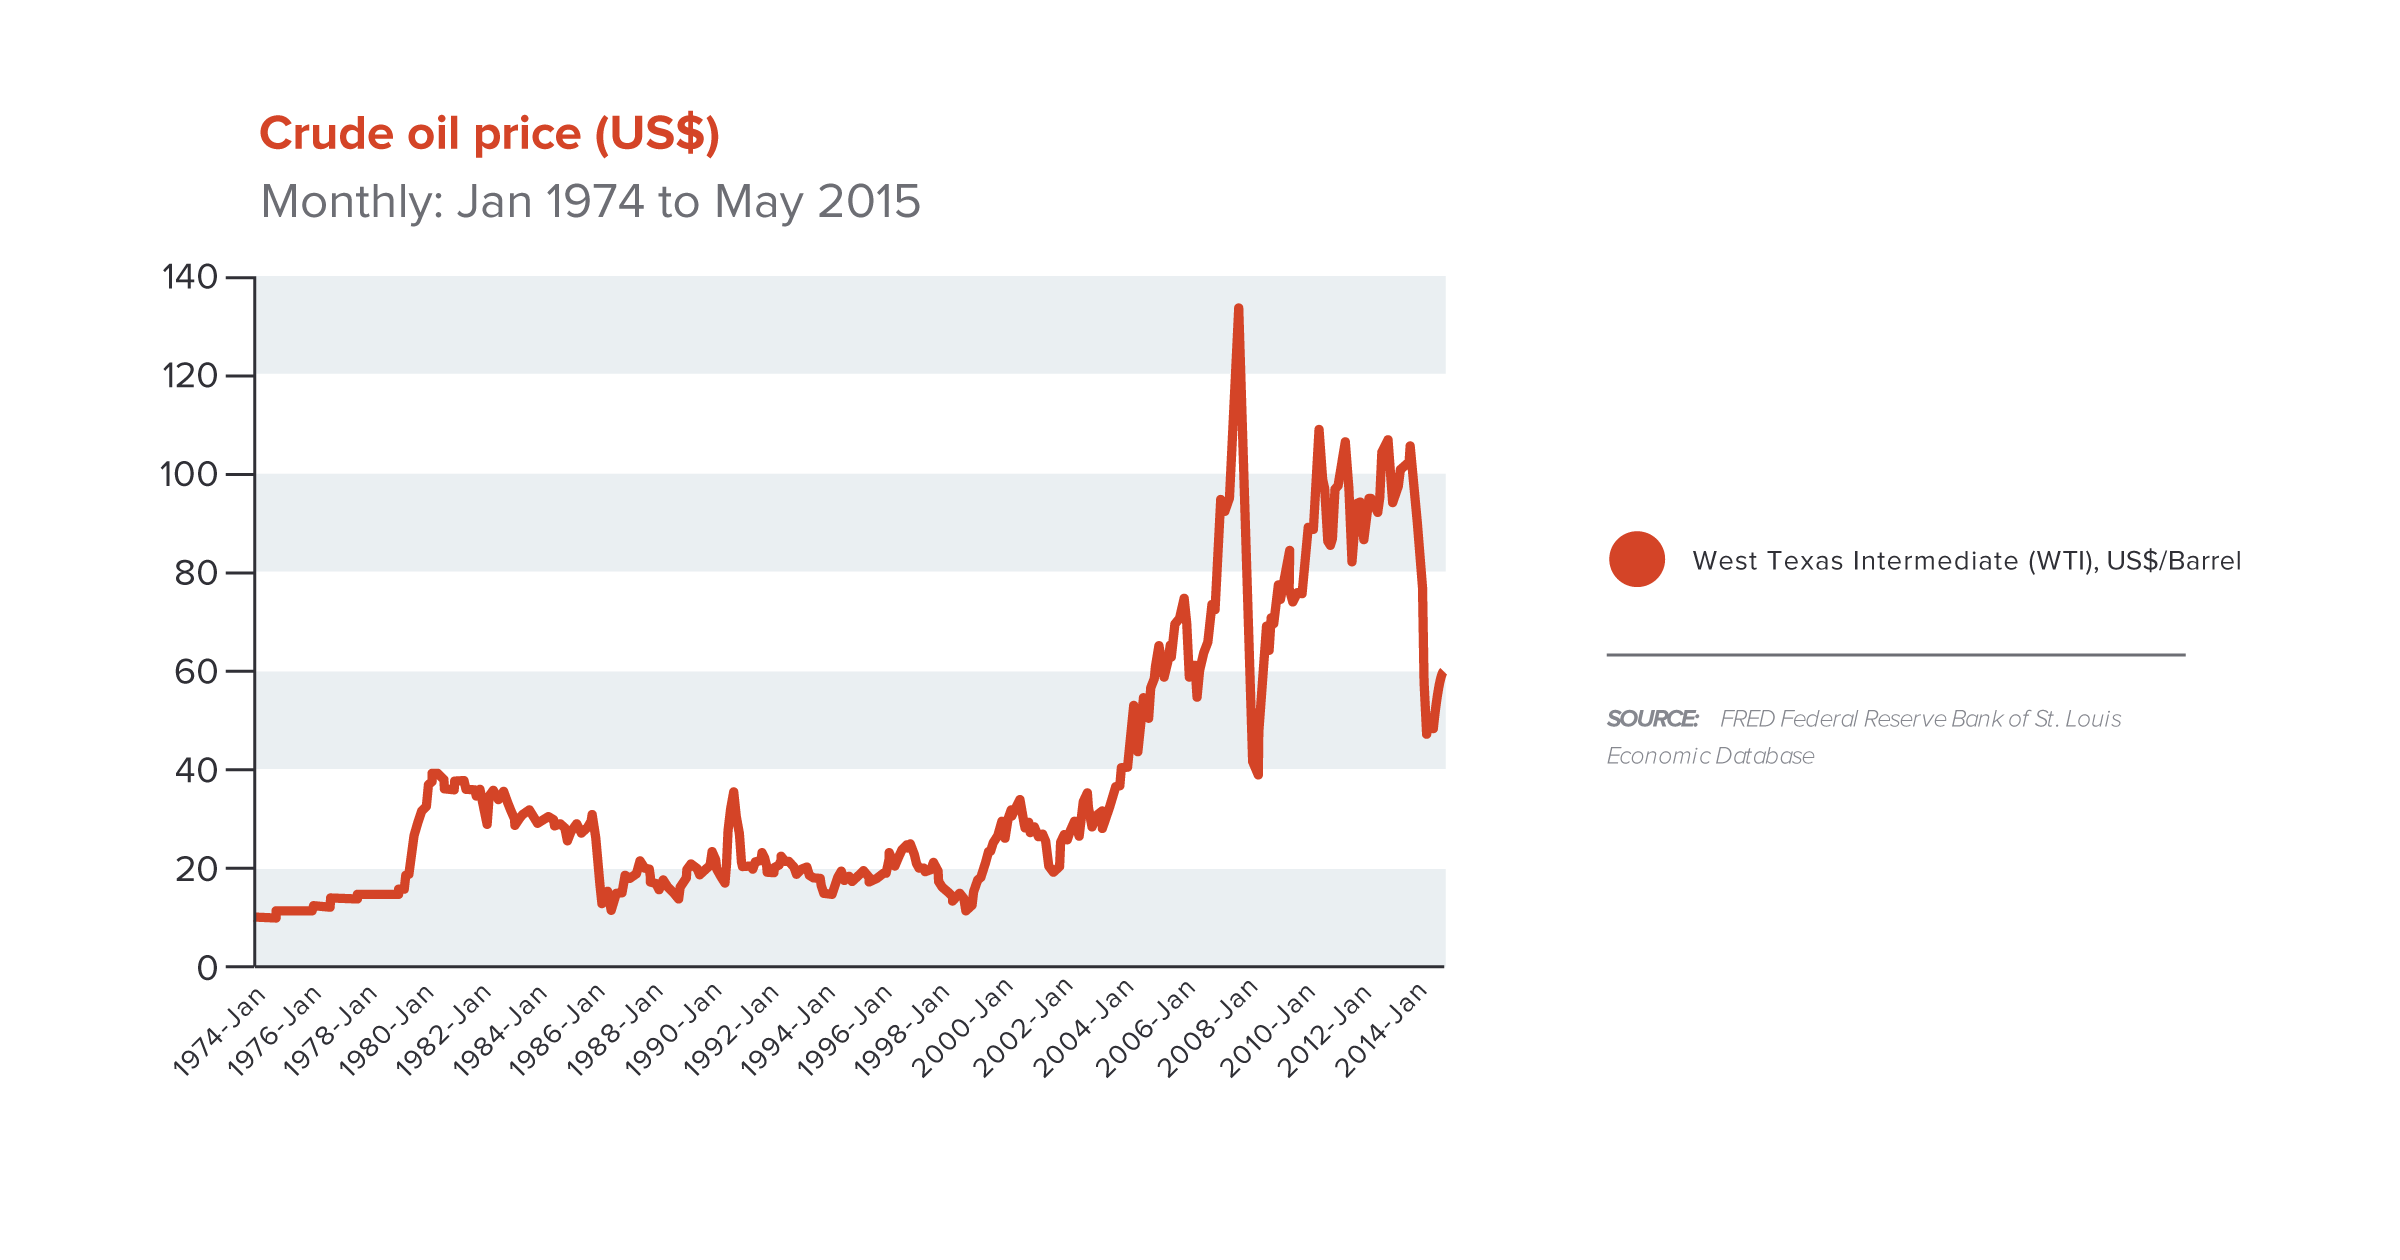
Figure 2. Crude Oil Price. Source: FRED Federal Reserve Bank of St. Louis Economic Database.15
Initially, there were understandable fears that the drop in oil prices might halt the rising demand for alternatives to fossil fuels, such as improved energy efficiency, renewables and electric vehicles. But this now looks unlikely, given the momentum of innovation and falling costs in renewable energy and energy efficiency. Indeed, greater energy efficiency and reliance on clean energy will provide an important hedge against the risk of much higher oil prices in the future. Nevertheless, countries may need to adjust their support for clean energy in the near-term to ensure that its long-term benefits are not disrupted by the near-term decline in oil prices.16 Enhancing international efforts to bring down the cost of capital for renewable energy and raising energy efficiency standards, as we discuss in Sections 2.3 and 2.4, will be particularly important.
A number of countries are taking advantage of the low oil prices to accelerate fossil fuel consumption subsidy reforms and the adoption of carbon pricing through carbon emission trading schemes (ETS) or carbon taxes. These reforms can help offset the near-term incentives for more fossil fuel consumption created by low oil prices, while yielding important long-term benefits for economic efficiency, energy security, government budgets, cleaner air and reduced climate risk, especially given the high volatility and uncertainty of oil prices in the future.17 With the right approach and flanking policies to address social impacts, these reforms can be maintained even if oil prices increase. This is discussed further in Section 2.5.
As of 2015, about 40 countries and 20 sub-national jurisdictions representing almost a quarter of global GHGs have explicit carbon pricing policies in place or planned.18 Taken together, the carbon pricing instruments in these jurisdictions currently cover about half of their GHG emissions, equivalent to 7 Gt CO2e, or about 12% of global GHG emissions – triple the 4% covered in 2005. Important recent developments include the successful operationalization of pilot trading schemes in seven cities and regions in China, with a national ETS to be launched in 2016; the introduction of Korea’s ETS in 2015; and the successful linking and expanding of the regional trading schemes in California and Quebec in 2014. They will be joined this year by Ontario.19 Chile and Portugal have adopted carbon taxes, and South Africa plans to introduce one in 2016. India has increased excise taxes on diesel and petrol, representing an increase in implicit carbon prices.
It is clear that these reforms, while nationally determined, are mutually reinforcing, each making it easier for others to be introduced, as fears over competitiveness impacts are reduced and a sense of a “new policy normal” is created. As we note in Section 2.5, the various international initiatives now under way to build political support for carbon pricing, including among businesses, have the potential to expand its use much further.
Fossil fuel consumption subsidies in emerging and developing economies totalled US$548 billion in 2013, while fossil fuel exploration, production and consumption subsidies in OECD countries amount to US$55–90 billion a year.20 But some 28 countries are now undertaking energy subsidy reforms, with reductions in consumer subsidies in countries such as Mexico, Egypt, Indonesia, Ghana, and India. Several others are considering additional steps, including Morocco and Jordan.21 Lower oil prices have made this easier, though the political challenges remain formidable. In terms of production and exploration subsidies, low oil prices have, if anything, increased the pressure to maintain support. What countries undertaking reforms have almost all found, however, is that, while fossil fuel consumption subsidies are often introduced as a form of social protection, they are in practice regressive, with the richest 20% of the population typically capturing 40–50% of subsidy benefits, while the poorest 20% usually get much less than 10%.22 Well-targeted cash transfers provide more effective and efficient social protection for the poor, and many countries are now benefiting from the learning of others as policy practice spreads internationally (see Section 2.5).
Infrastructure investment has risen to prominence on the international economic agenda in recent years. At its Brisbane Summit in 2014 the G20 established a new Global Infrastructure Initiative, along with an implementing “Infrastructure Hub”, with the aim of catalysing both public and private investment.23 Around the same time, the World Bank launched a Global Infrastructure Facility with other multilateral development banks and private sector investors to help deliver major infrastructure projects in low- and middle-income countries.24 New multilateral and national development banks are being established with a specific infrastructure focus, notably the Asian Infrastructure Investment Bank25 and the New Development Bank.26 There is increasing interest in catalysing private financing of new infrastructure, particularly among institutional investors such as pension funds and insurance companies.27 This is also a growing focus of the international discussions around Financing for Development, as we discuss below.28
Better Growth, Better Climate estimates that the world will need some US$90 trillion of infrastructure investment in 2015–30 (an average of US$6 trillion a year), concentrated in cities, energy and land use systems. But it points out that the choice of infrastructure is critical. Many forms of infrastructure, including roads, public transport systems, power plants, water management systems and urban buildings make significant contributions to GHG emissions, and they are also particularly vulnerable to the rising incidence of extreme weather events. If long-lived investments are made without attention to wider impacts, such as on energy security, air pollution, GHG emissions and resilience to climate damage, the world will become locked into a carbon-intensive development path with severe risks to both growth and climate. Building low-carbon infrastructure would require not much more capital, perhaps an additional US$4 trillion of investment (around 5% more), and this could well be largely or completely offset by longer term operational savings on fossil fuel costs.
Extremely low long-term real interest rates in many advanced economies provide an extraordinarily favourable financing environment for infrastructure investment. In March 2015 the real interest rate on 10-year US government borrowings was less than 0.3% (as reflected in yields on inflation protected securities). In Germany and Japan the nominal yields on 10-year government bonds were below 1% (Figure 3), which, given inflation expectations, constitute effectively zero or negative real interest rates. Given the likelihood that interest rates will rise over coming years, this presents a major and probably time-limited opportunity to finance new infrastructure at very low cost. 29
Increasing investment in infrastructure is a powerful way to boost global economic growth, which remains mediocre. It can stimulate short-term demand in economies where it is weak, and ease supply bottlenecks and expand potential output elsewhere. Recent estimates by the International Monetary Fund (IMF) indicate sizeable and long-lasting impacts of public infrastructure spending on private investment and output. These effects are significantly larger during periods of slow growth and in countries with high public investment efficiency, which is critical to ensure that resources are not squandered on “white elephant” projects. Other studies document the impact of infrastructure in reducing poverty and distributional inequity in developing countries.30
Given the critical need to replace old and often crumbling infrastructure in the developed world, and the huge deficit in infrastructure spending in most developing countries, this creates a major opportunity to drive global growth. Calderon, C., and Serven, L., 2014. Infrastructure, Growth and Inequality: An Overview. World Bank Group, Washington, DC. Available at: https://openknowledge.worldbank.org/handle/10986/20365.[/footnote] But it has to be “climate-smart” – both low-carbon and climate-resilient. As we discuss in Section 2.6, it would be extremely short-sighted to build infrastructure which is immediately vulnerable to climate change impacts and/or to more stringent climate policy in the future.
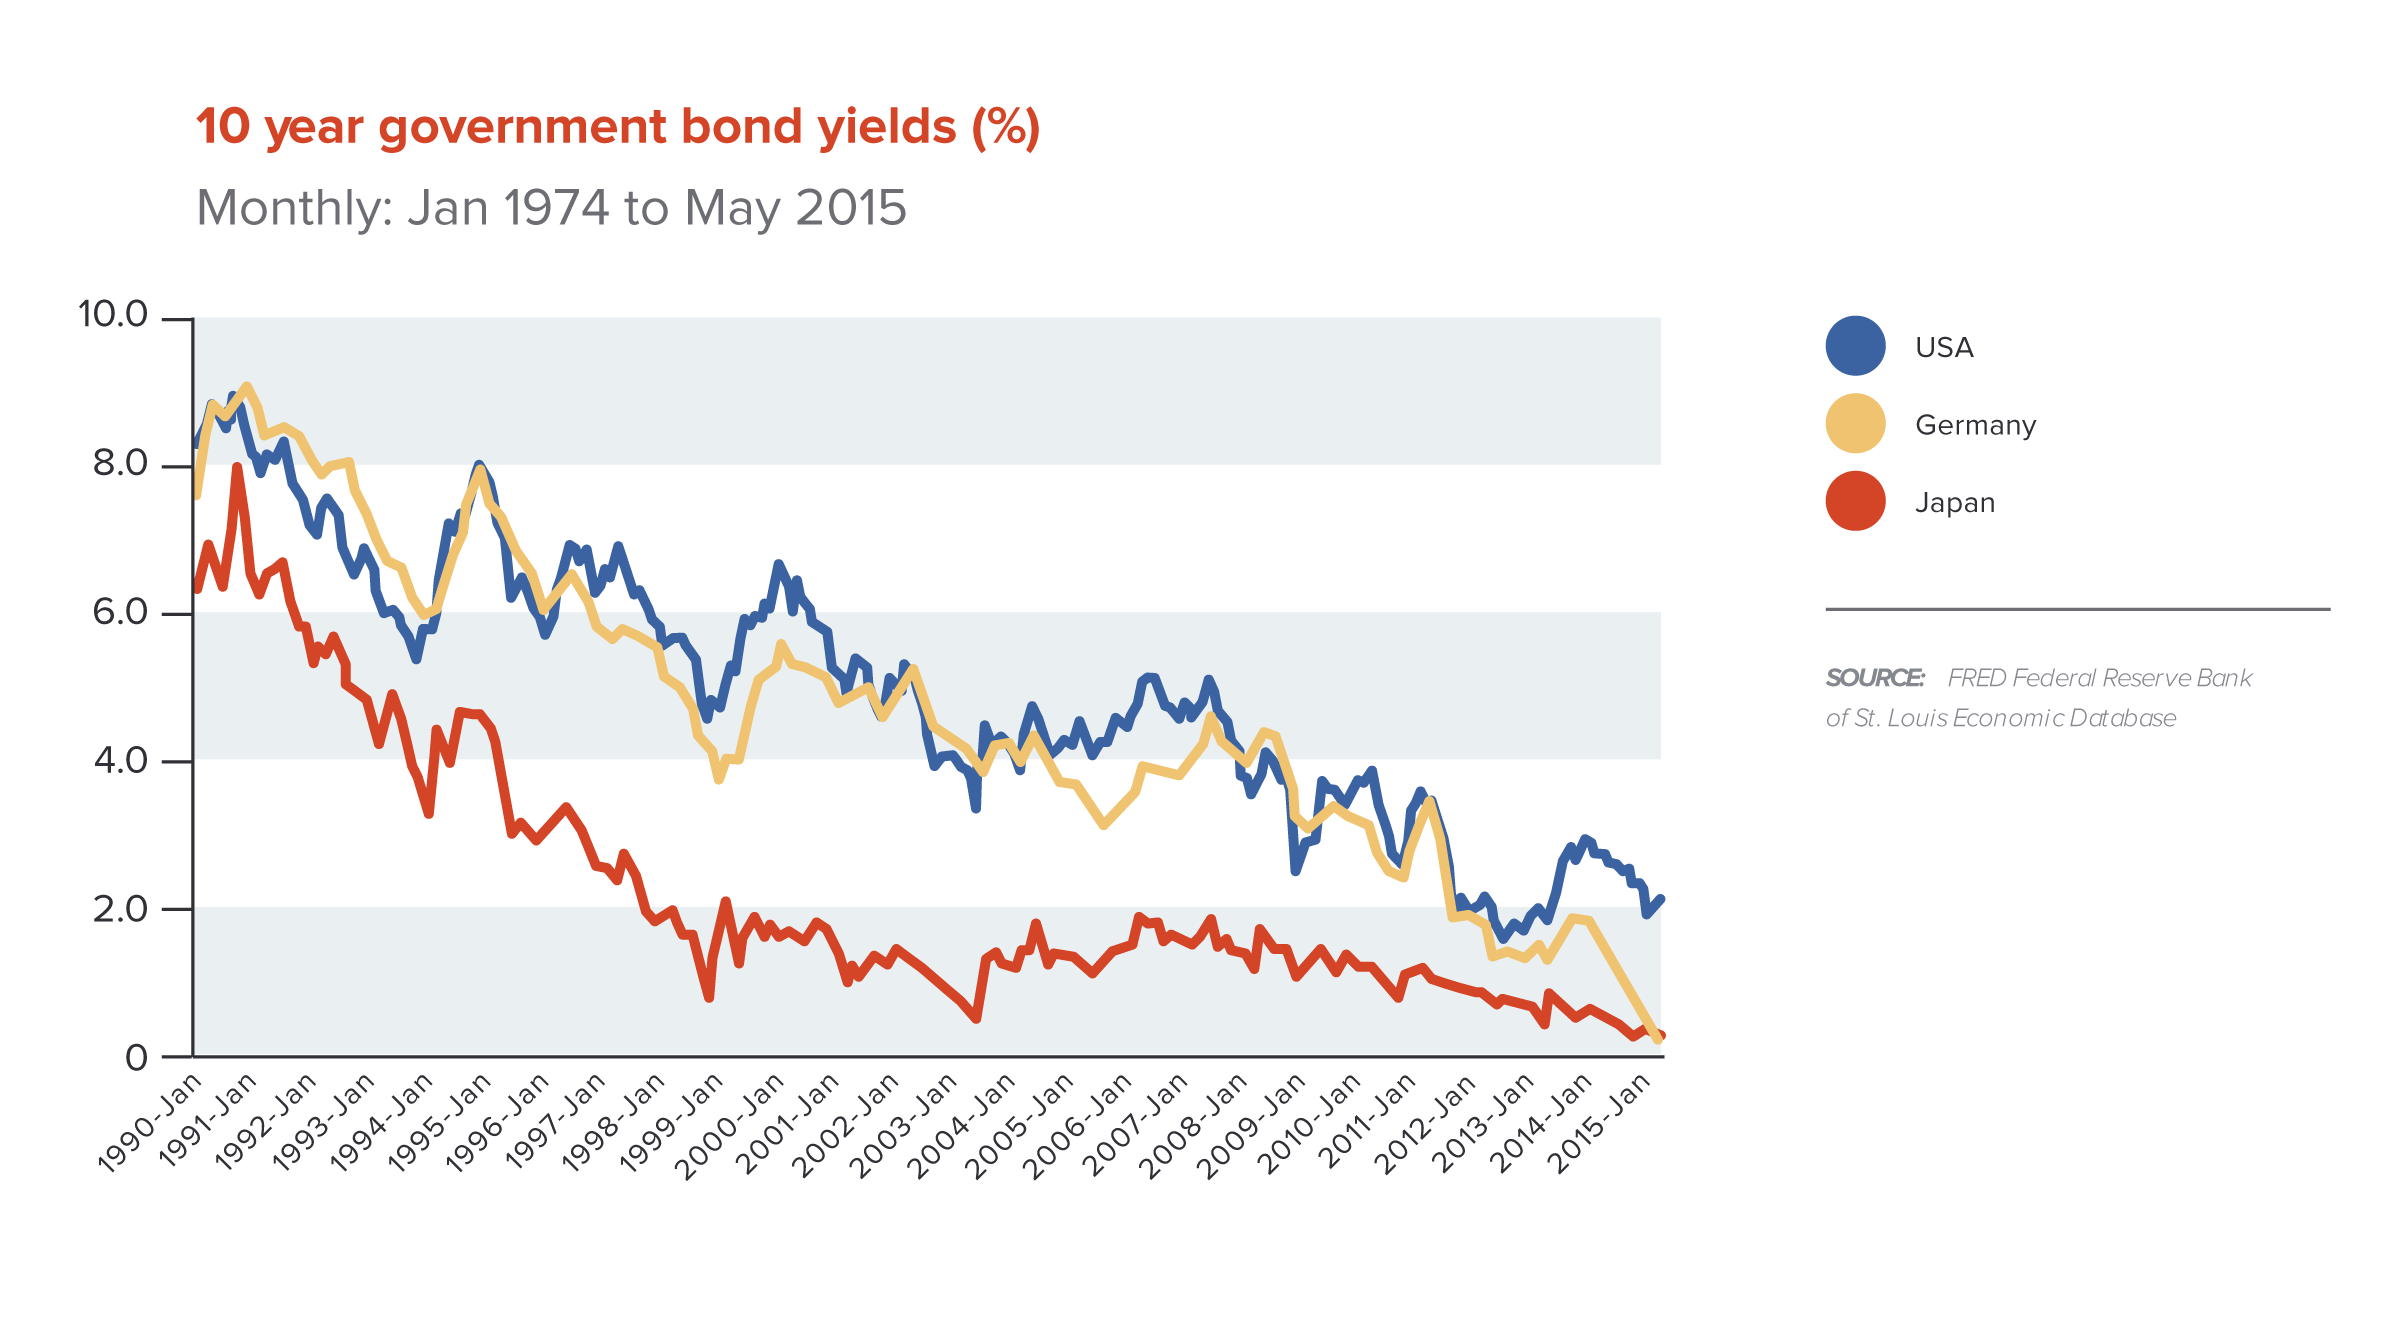
Figure 3. 10 Year Government Bond Yields (%). Source: Federal Reserve Bank of St. Louis Economic Database.31
The low real interest rates that advanced economies are enjoying are not being seen in most developing countries, which continue to face significantly higher market borrowing costs or are excluded from international capital markets altogether. Thus a major priority is to strengthen international collaboration on expanding the flow of climate-smart infrastructure finance to developing countries, as well as to tackle specific institutional and policy problems and uncertainties that inhibit private infrastructure investment.32 These efforts should include technical and other assistance to help low-income countries strengthen their public investment management frameworks and capacities.33
There is growing interest in climate risk within the financial sector. This is perhaps unsurprising in the global insurance industry, where climate risk is now widely integrated into both underwriting products and investment strategies. To increase risk transparency, the industry has embarked on a “1 in 100” initiative to develop climate risk metrics for one-in-100-year catastrophic events to be applied across private and public sector actors.34 In the US, insurance regulators in several major states are implementing an annual Insurer Climate Risk Disclosure Survey.35 But action is now spreading. Central banks, financial sector regulators, capital market authorities and finance ministries are also now beginning to include consideration of climate risks in the rules governing financial systems. The aim is to send clearer signals to financial markets, better aligning incentives for private investors with the true social cost of investment in fossil fuels and the benefits of clean investments.
The Bank of England, for example, is studying the impact of climate risks on the UK financial system, including both physical risks (such as catastrophic weather events) and transitional risks (related to the speed of transition to a low-carbon economy), while the Bank’s Prudential Regulation Authority is reviewing the implications of climate change for the safety and soundness of insurance companies. Brazil’s Central Bank has issued requirements for all banks to introduce systems for assessment of climate and other socio-environmental risks. A small but growing number of countries now have legal requirements for institutional investors to report on how their investment policies and performance are affected by environmental factors, including South Africa and, prospectively, the EU.36 Concern about the risks of a “carbon bubble” – that highly valued fossil fuel assets and investments could be devalued or “stranded” under future, more stringent climate policies – prompted G20 Finance Ministers and Central Bank Governors in April 2015 to ask the Financial Stability Board in Basel to convene an inquiry into how the financial sector can take account of climate-related issues.37
Investors more generally are starting to become engaged. Following the passage of shareholder resolutions requiring BP and Shell to disclose their climate risks and strategies in spring 2015,38 62 institutional investors representing nearly US$2 trillion in assets called on the US Securities and Exchange Commission to push for better disclosure of such risks by oil and gas companies in general.39 Others are now divesting from fossil fuel assets, particularly coal. Over the past three years more than 220 institutions, including colleges and universities, cities, religious institutions, pension funds, foundations and others have committed to such divestment.40 In May 2015, Norway’s sovereign wealth fund, one of the top 10 investors in the global coal industry, announced it would withdraw up to US$10 billion of investment from companies heavily reliant on coal.41
At the same time as attention to climate risk has been rising, there has also been increasing concern to ensure that financial systems are adequately structured to invest in the low-carbon economy. The UN Environment Programme’s Inquiry into the Design of a Sustainable Financial System is conducting a two-year examination with the support of central banks and financial regulators across the world.42 China is already working on a comprehensive framework for a “green financial system”, including strengthening legal frameworks, improving information, increasing fiscal and financial policy incentives and developing its national development banks as leaders in green finance.43
Countries and jurisdictions such as Brazil, China, the European Union and India are also reforming regulations and incentives in order to promote the development of markets for “green bonds” and other investment vehicles for environmental and low-carbon infrastructure and assets. Issuances of green bonds (corporate, municipal or institutional bonds with proceeds earmarked for an environmentally-friendly project, or project bonds issued specifically with the backing of clean energy projects) have grown rapidly in recent years, from less than US$5 billion per year in 2007–12 to US$11 billion in 2013 and US$37 billion in 2014. Other investment vehicles are also expanding rapidly. In just two years, 15 “YieldCos” (publicly-traded companies paying dividends to shareholders from portfolios of owned renewable energy projects) have been set up in the US, Canada and Europe, with a total market capitalization of well over US$20 billion.44 Several major global banks have made public commitments to increasing their investments in environmental and climate-related projects, including Bank of America and Citigroup.45
These are positive trends, yet they remain small relative to total global financial flows. There is thus great scope to scale up international financial initiatives to increase the capital allocated to low-carbon investment. We discuss this further in Section 2.3.
A growing number of developing and emerging economies are building “green growth” and environmental sustainability into their national development and poverty reduction strategies. This reflects a recognition that countries in a wide range of economic circumstances can achieve their development goals through more sustainable approaches than others have pursued in the past.46
Rwanda, for example, a least developed country, adopted a Green Growth and Climate Resilience Strategy in 2011, aiming to mainstream climate goals into its economic development and poverty reduction plans. It aims for Rwanda to become a developed country by 2050, based on its renewable energy resources, particularly geothermal; integrated soil fertility management in its agricultural sector; and the development of high-density, “walkable” cities.47
Ethiopia, another least developed country, adopted a Climate Resilient Green Economy (CRGE) Initiative as part of its Growth and Transformation Plan (GTP) for 2010–25.48 It seeks to secure “triple wins”: simultaneously raising productivity, strengthening climate resilience and reducing GHG emissions, and tries to address trade-offs between these objectives. It includes initiatives to disseminate efficient cookstoves, and to introduce new soil management methods and agricultural technologies to raise yields and reduce emissions from agriculture, which will also reduce deforestation pressures. At the same time, as part of the drive to achieve middle-income status by 2025, the GTP aims to dramatically increase power generation capacity and energy access by exploiting the country’s considerable renewable power potential, through hydroelectric power, wind, geothermal and biofuels.
Increasing energy production to achieve universal access and also support economic growth is a key development challenge for almost all countries in sub-Saharan Africa and for several in Asia, including India. In its 2015 report, the independent African Progress Panel led by Kofi Annan argues that the huge need to expand energy production in Africa will inevitably require continuing use of fossil fuels, including coal.49 But the report also finds that Africa could “leapfrog” over the fossil fuel-based growth paths of developed countries and should aim to become a leader in low-carbon development, exploiting its abundant – and still barely utilised – renewable energy resources. This would require a significant increase in energy investment, amounting to around 3.4% of Africa’s GDP. Countries such as Brazil have shown how energy supply can be increased rapidly; others such as Kenya and Bangladesh are pioneering new approaches to financing decentralised solar power.50 For example, Grameen Shakti operates a microcredit model that has financed more than 220,000 solar home systems and 30,000 energy-efficient cookstoves in Bangladesh.51 But achieving the UN goal of universal access to energy by 2030 will require the support of the international community, including a significant scaling-up of finance and technical assistance. We discuss this further in Section 1.3.
China offers perhaps the most striking example of new policies. It has now embarked on a historic structural transformation that has global implications: both directly, because of China’s role in the world economy, and indirectly, by the lessons it provides to other developing countries. China is moving away from a development model based on rapid growth in capital accumulation and energy-intensive export industries, powered largely by coal. It is seeking to move towards an economy based on growth in domestic consumption and services, with stronger innovation and more efficient resource use, powered increasingly by cleaner forms of energy. At the same time it is trying to reverse old patterns of urbanisation, which resulted in sprawl and rising air pollution. China’s leaders have listed what they describe as building an “ecological civilisation” as one of the country’s five top priorities guiding reforms. Severe air pollution is a key driver. In September 2013 China banned construction of new conventional coal-fired power plants in major economic areas, and in 2014 it instituted a national cap on coal consumption. Coal consumption in 2013–14 is estimated to have grown by only 0.1%, and may now have peaked.52
At the same time, strong measures are being implemented to promote energy efficiency and expand nuclear, hydro, solar and wind power generation; China now has the most installed wind power and second most solar PV in the world.53 Among the seven “strategic emerging industries” prioritised for economic growth in the government’s 12th Five Year Plan (2011–16), five are environmental sectors, including new energy sources, energy conservation and clean vehicles.54 China remains heavily coal-dependent, and its global growth is a major source of rising GHG emissions, but this is a serious shift in the form of its economic development.
These examples – and others in very different contexts, such as in Colombia, Costa Rica, South Korea and Indonesia – are indicative of a more widespread shift in the understanding of development paths. An increasing number of developing and emerging economies are coming to view environmental sustainability and climate action as integral elements of their growth strategies. But international cooperation – through increased flows of knowledge, financing and other resources – will for most developing countries be critical if these strategies are to be realised.55
The International Energy Agency (IEA) estimates that global CO2 emissions from fossil fuel combustion held steady at about 32 Gt in 2014, the first time in 40 years that a halt or reduction in global emissions has not been associated with an economic crisis.56 Global GDP, meanwhile, grew by just over 3%. This means that the CO2 intensity of global GDP also fell by just over 3%. Examining these trends and future options, the IEA observes that, while definitive conclusions cannot be drawn from a single year, there are now positive signs that climate change mitigation efforts have the potential to decouple growth from emissions over the coming period.57
Although detailed information is not yet fully available, declines in China’s coal consumption and CO2 emissions in 2014 appear to have been an important contributor to the apparent halt in global emissions growth, the result of strong policies to reduce air pollution, curb coal use, promote energy efficiency and expand low-carbon power generation capacity.58 Efforts to increase carbon pricing, boost energy efficiency and shift to renewable energy are also helping to decouple CO2 emissions from growth in both advanced and a range of emerging and developing economies. The reduction in the CO2 intensity of global GDP adds to the growing body of evidence that countries can reduce GHG emissions while sustaining economic growth.
However, climate risk is still rising. The level of emissions remains extremely high, and it is still too early to conclude that it has stabilised. The IEA’s 2 degrees scenario (2DS) – defined as an emission pathway which gives at least a 50% chance to keep the mean temperature increase below 2°C – provides a measure of the challenge ahead. The specific pathway explored by the IEA would entail reducing CO2 emissions from energy consumption by almost 60% to reach 14 Gt CO2 by 2050, with a decline to zero net emissions in the second half of the century. To get there, the IEA estimates that the world energy-intensity of GDP (broadly reflecting energy efficiency) and the carbon-intensity of primary energy consumption (broadly reflecting the share of fossil fuels in the energy mix) would both need to fall by 60% from 2012 to 2050, or by around 2.6% per year. The sum of these two measures is reflected in the CO2-intensity of GDP. In the IEA’s 2DS scenario, which assumes an average annual global growth rate of just over 3%, the CO2-intensity of GDP would need to fall by close to 85% from 2012 to 2050, or by a global average of 5.3% a year.59 For developing countries, improving emissions intensity allows for strong GDP growth while total emissions peak and then ultimately decline.
| Table 1. Growth in World CO2 Emissions from Energy and its Drivers | |||
| 1980–2000 | 2000–2010 | 2010–2014* | |
| Annual average growth (%) | |||
| CO2 Emissions | 1.5 | 3.2 | 1.9 |
| GDP | 3.1 | 3.8 | 3.2 |
| CO2-Intensity of GDP | -1.5 | -0.5 | -1.3 |
| Energy-Intensity of GDP | -1.3 | -1.2 | -1.4 |
| CO2-Intensity of Energy | -0.2 | 0.7 | 0.1 |
| Sources and methods60*Estimates including NCE staff estimates for incomplete data. | |||
Table 1 documents recent trends in world CO2 emissions and three drivers: GDP growth, the energy-intensity of GDP and the CO2-intensity of energy. Carbon dioxide emissions growth did slow significantly, from 3.2% per year in 2000–2010, to 1.9% in 2010–2014. Notably, a little over half of this decline was due to an accelerating decline in the CO2-intensity of GDP, to an estimated average of -1.3% per year in 2010–2014. Because of incomplete data, we are less certain about recent trends in the components of the CO2-intensity of GDP. Nevertheless they are moving in the right direction. The pace at which the energy-intensity of GDP is falling appears to have picked up modestly, to perhaps -1.4% a year in 2010–14. The CO2-intensity of energy – the “dirtiness of the energy fuel mix” – was actually rising by around 0.7% a year in 2000–2010, primarily due to rising fossil fuel use in developing countries. However, CO2-intensity growth appears to have slowed significantly in 2010–2014, and may even have stabilised. But the challenge is clear. Although GHG emissions are gradually being decoupled from growth rates, they are not doing so at anything like the rate required to put the world on a 2°C path.
This makes the need for both low-carbon and climate-resilient development strategies even more urgent. Growth in developing economies has steadily decelerated from 2010 to the present, and remains weak in advanced economies. World trade is growing at less than half its pre-crisis trend,61 and there are concerns that global poverty reduction, which accelerated in the first decade of the 21st century, is now slowing down.62 A billion people still live on less than US$1.25 a day, now largely concentrated in sub-Saharan Africa and South Asia, with around 2.4 billion on less than US$2 a day.63 Yet the continued rise in climate risk is most threatening to the global poor, who are particularly vulnerable to the impacts of climate change. Indeed, the warming towards which the world is currently headed, of 3°C or 4°C or more, could effectively reverse much of the development progress made over the last half century.64 Adaptation programmes designed to increase resilience to climatic changes must therefore be an integral part of development and poverty reduction strategies, and need much greater attention and financing.65 Yet adaptation alone is not enough, for without strong and early mitigation action, temperatures will continue to rise.
Both the need and the opportunity are therefore very great. By instigating a step-change in the rate of investment, particularly in infrastructure, and by ensuring that this is both low-carbon and climate-resilient, the international community has the potential to achieve multiple goals at once. It can stimulate global growth, restore progress on development and poverty reduction, and tackle climate risks. This will require serious and sustained attention to policy reform. Major obstacles – the protracted effects of the global financial crisis, the inheritance of deeply embedded market failures, weaknesses in policies and institutions, and the momentum of a high-carbon economic model built up over the last 150 years – all continue to inhibit stronger economic performance. But the potential, and the prize, are large.
These six recent trends and developments are all encouraging, but it is clear that none is yet occurring at a scale or pace sufficient to create a decisive shift in the direction of the global economy. As argued in Better Growth, Better Climate, national governments need to focus attention on the policies and institutions which can drive the necessary reforms: increasing resource efficiency, raising infrastructure investment and stimulating innovation, particularly in the three economic systems of cities, land use and energy. Box 2 summarises lessons learnt from different countries about best practices in policy-making for low-carbon growth.
Both the World Bank and the OECD have recently published studies bringing together learning and experience of successful policy-making for low-carbon growth.66 The World Bank identifies three core principles. First, policy-makers need to plan with an eye on the long term. There are different ways to achieve short-term emissions reductions. But if the end goal is decarbonisation, it is vital that decisions now do not lock in high emissions in the future. Understanding the multiple economic, social and environmental benefits of low-carbon action, as Better Growth, Better Climate argues, can help long-term decision-making.
Second, carbon pricing is important, but has to be part of a wider policy package that triggers far-reaching changes in investment patterns, technologies and behaviours. The OECD shows how better alignment and integration of national policies and regulatory frameworks across ministries and sectors offers huge potential to achieve stronger impacts and reduce costs.67 In many countries, misaligned policies are common, making policy goals much harder to achieve. A case in point is the continuing subsidisation of fossil fuel production and consumption even in countries with climate change mitigation policies. But there are many other areas where better alignment is possible, from financial prudential frameworks that inadvertently discourage long-term investment, to the continued decline in funding for energy RD&D as a share of total RD&D spending. Aligning policies in specific sectors is also important – for example, in electricity markets and urban public transport.
Third, managing the political economy of change is critical. As Better Growth, Better Climate argues, governments need to ensure that the shift towards a low-carbon economy is a “just transition”. Not all climate policies are “win-win”: although many jobs will be created, and there will be larger markets and profits for many businesses, some jobs will also be lost or need to evolve, particularly in high-carbon sectors. The human and economic costs of the transition should be managed through local economic diversification plans and support for displaced workers, affected communities and low-income households. Adequate social protection will be needed, along with active labour market policies to assist retraining and redeployment where necessary. Social dialogue and democratic consultation of social partners (trade unions and employers) and communities is important to ensure acceptance and trust. National transition plans are a valuable first step.68
National policy is critical. But the impact of national action can be greatly amplified when markets become global. The story of solar power provides an illustration. The dramatic reduction in the cost of solar PV over the last decade arose not just from advances in technology, but from governments’ policy choices. The introduction of a solar feed-in tariff in Germany in 1991 led to a rapid rise in demand over the following two decades, while investment in solar manufacturing in China enabled costs to fall and supply to be expanded. The result has been the creation of a global market, expected to be worth around US$75 billion in 2016 (up from just US$40 billion just five years before),69 with solar power in various uses now affordable throughout the world.
These and other examples – such as the comparable reduction in the costs of LED (light emitting diode) lighting over the last decade, and the rapid spread of mobile phones in Africa, which are making landlines increasingly obsolete – show how the creation of global markets and new business models can help transform individual technologies and national policies into dramatic agents of change, reducing costs, driving innovation and catalysing widespread dissemination.
Many of these processes have occurred without a deliberate process to drive them. But in many other cases, cooperation among governments and multiple other stakeholders – businesses, international organisations and civil society – has played a crucial role in scaling up and accelerating transformative change.
First, such cooperation can be a powerful way of expanding markets and reducing costs. For example, over the last two years, international trade negotiations have moved towards reducing tariffs on low-carbon goods and services.70 Convergence of national energy efficiency standards for appliances and industrial equipment can equally expand the available markets for national producers and reduce the transaction costs of exporting. Collective procurement of low-carbon goods and services by a number of city authorities and governments – in fields such as electric buses or low-carbon construction materials – offers another cooperative route to scaling up demand and cutting costs.
Second, for countries concerned that standards, carbon pricing or other climate policies could affect their international competitiveness, international cooperation can help overcome these anxieties. If multiple countries – particularly competitors – act together, this can help keep the playing field level. The same is true among businesses in globally traded sectors, which may find it difficult to take ambitious action alone. In both business and the public sector, leadership associations and “clubs” have helped support pioneers to take bolder action, both spurring them on and protecting them against internal criticism. When there is public scrutiny, the power of example can begin to change the norms of behaviour even where action is voluntary. Yet public policy reinforcement is also needed; for example, it is notable that the Tropical Forest Alliance 2020, which is working to eliminate deforestation from commodity supply chains, is not just a business coalition, but also involves governments in both forest and importing countries.
A third key benefit of international and multi-stakeholder cooperation is that it can enable extensive knowledge-sharing and capacity-building, and help identify and disseminate best practices. Opportunities for action on climate change are constantly developing, leading to a lot of “learning by doing”. Many international cooperative initiatives are already facilitating the exchange of information on technologies, standards, policies and business models for climate action. They have particular value in scaling up solutions, and in transferring knowledge across countries and sectors. While historically, this has mostly involved North-South cooperation, there has been a rapid rise in South-South cooperation in recent years.
Fourth, and crucially, international cooperation is essential for expanding finance flows, particularly to the poorest countries and to sectors and activities that may not, on their own, attract sufficient private investment. This is one of the most important forms of intergovernmental cooperation, and another area where South-South cooperation is growing.71 The multilateral development banks, UN agencies and other international organisations and partnerships are particularly important institutional vehicles for financial flows and capacity-building, with their strong capabilities in technical assistance. Achieving new agreements for future flows of both public and private finance to support sustainable development is a vital priority for both the Financing for Development and COP21 processes in 2015 (see Box 3). As we discuss in Section 2.7, financial cooperation is also important in the field of research, development and demonstration (RD&D), allowing countries and businesses to share the costs of accelerating and disseminating new technologies.
The major international meetings being held this year – the International Conference on Financing for Development in July, the United Nations Summit to adopt the post-2015 Sustainable Development Goals (SDGs) in September, the G20 Summit in November, and the UN Climate Change Conference (COP21) in December – provide critical opportunities to scale up investment to deliver both development and climate objectives.
In all these arenas it is crucial to take an integrated approach to building finance frameworks, so they can deliver both development and climate objectives together. While there are important differences of emphasis between the two agendas, the draft SDGs under discussion recognise significant synergies, and these need to be fully realised. Key areas in which the financing framework must be properly integrated include delivery of low-carbon infrastructure; promoting energy efficiency; building climate resilience and adaptation; halting deforestation and reversing land degradation; and fostering innovation.
Scaling up finance that supports both development and climate objectives will entail expanding domestic resource mobilisation, both public and private: this is an important need in many developing countries. But it also requires much larger international flows, in particular to developing countries, from both public and private sources. The role of multilateral and regional development banks in infrastructure, climate and other development financing needs to be significantly expanded, along with their support for efforts to establish and strengthen domestic policy frameworks. This should include increasing their capital base, allowing greater flexibility in the management of their balance sheets and streamlining decision procedures, alongside wider efforts to mainstream both climate change into investment strategies and development objectives into climate financing. (This is discussed further in Sections 2.3 and 2.6.)
While clean energy funds and other development financing vehicles have expanded greatly in recent years, more can be done. Institutional and policy problems that inhibit private investment in infrastructure and low-carbon projects urgently need to be tackled. Developing bankable projects that have the right risk-return profile to attract private-sector finance remains a challenge. Some of the solutions include more stable policies to reduce investor uncertainty, as well as development of risk-sharing instruments, blended finance approaches and reform of financial sector regulations to increase the demand for clean infrastructure assets in institutional investor portfolios.72 (This is discussed further in Section 2.3.) This will require strengthening institutions and policies for both public revenue and expenditure, as well as promoting development of local capital markets and financial systems. The outcomes of the Addis Conference on Financing for Development, where countries will agree how to finance delivery of the SDGs, should launch efforts to deliver on this agenda.
It is within this broader context that countries meeting at the UN Climate Conference in Paris need to agree on a new climate finance package. In Copenhagen in 2009, and confirmed in Cancún in 2010, developed countries agreed to mobilise US$100 billion per year by 2020 for developing-country climate action, from both public and private sources.73 The Green Climate Fund, an important vehicle for delivering this finance, was operationalised last year after achieving US$10 billion in (multi-year) pledges. But a clearly agreed path on how finance will be increased to US$100 billion per year from these levels is still needed.74 Public finance flows remain critical, particularly for adaptation and strengthening resilience. These funds, in turn, must leverage far greater sums in private investment, both domestic and international.
Continued efforts are needed to improve definitions of climate-relevant investment, to measure, report and verify financial flows and identify mobilised finance, and to understand and improve the effectiveness of such investment on adaptation and mitigation on the ground. A new UNFCCC agreement, as well as collaborative action agreed in other forums, will be essential to trigger wider action to deliver more sustainable infrastructure investment in all countries. For example, it could reinforce commitments to reduce and rationalise fossil fuel subsidies, and strengthen the assessment of climate risks and opportunities in fiscal and financial systems.75
At the centre of international cooperation on climate change is the UN Framework Convention on Climate Change (UNFCCC). Despite slow progress in recent years, negotiations are now well on the way to achieving a comprehensive new climate agreement at the Paris Climate Change Conference (COP21) in December. If countries can reach an agreement involving universal participation, it will be historic, as it will mark the first time that all countries make climate action commitments under the UNFCCC.
Such an agreement is important to create an equitable, rules-based system for the global governance of climate change. But as Better Growth, Better Climate argues, a strong agreement will also provide a clear signal to businesses and investors that the global economy is moving towards a low-carbon pathway. This will help shape economic expectations, spurring investment and innovation in low-carbon and climate-resilient economic activity. It will therefore in itself act to scale up global markets and reduce costs, while at the same time making the risks attached to high-carbon investment more transparent.
Better Growth, Better Climate identifies key features of an agreement which would enhance this signalling effect, summarised in Box 4.
It is not the Commission’s role to recommend the specific design of a new international legal agreement. But building on the conclusions of Better Growth, Better Climate, there are some core features which would enhance the ability of an agreement to send a clear signal to businesses, investors and governments on the future low-carbon and climate-resilient character of the global economy. These include:76
An international agreement will contain many other provisions; this is not intended to be a comprehensive description. But an agreement which included these elements would provide a major boost to international economic confidence.
Over the last 18 months, most countries have been preparing INDCs that set out their national targets, plans and policies beyond 2020 to be included in the Paris agreement; several have already been published.77 In most countries the preparation process for these documents has required a serious – and in some cases unprecedented – analysis of how greenhouse gases are related to growth trends, and how these can be decoupled, absolutely or relatively. In many this represents an important step forward for the integration of climate considerations into mainstream economic planning.
Some INDCs represent historically ambitious commitments that will require considerable domestic effort to implement.78 Nevertheless, initial assessments suggest that it is very unlikely that the mitigation actions pledged will add up to a global emissions reduction consistent with a 2°C pathway. Early estimates suggest that global emissions in 2030, if the current and expected INDCs are implemented, will be around 55–61.5 Gt CO2e (up from 49 Gt CO2e in 2010).79 This would still be well above the median level of emissions (estimated to be around 42 Gt CO2e) needed to have a more than 50% chance of putting the world on a 2°C path. Given the huge costs which would be involved in reducing emissions far more rapidly after 2030 – likely to involve the writing off of many assets – it may in effect risk putting 2°C out of reach.80
Thus it is essential that the INDCs submitted in 2015 are not only as ambitious as possible, but are also seen as the starting point, rather than the limit, of countries’ climate ambition over the coming years.81 This would follow the logic of policy-making: it is evident that policies which affect emissions a decade or 15 years into the future will not cease being made in 2015. Indeed, given the trends discussed in Section 1.1, there are strong reasons to believe that low-carbon options will become increasingly affordable and accessible. As they do so, policy-makers should be encouraged to increase the ambition of their climate targets and policies.
Some have already done this. The EU’s INDC frames its 2030 target as a cut of “at least” 40% on 1990 levels, leaving room for deeper cuts in the context of a successful international agreement. Mexico has explicitly set two targets, one an “unconditional” GHG emission reduction of 25% below business as usual by 2030, the other a “conditional”’ reduction of 40%, which could be achieved subject to progress on a variety of issues such as an international carbon price, technical cooperation and access to low-cost financial resources and technology transfer.82 It would be helpful if this approach could be reflected in the general understanding that INDCs published in 2015 are “floors, not ceilings” – lower bounds to ambition which can be strengthened when circumstances change, either before or after the Paris conference.
International cooperation on climate-related issues has also blossomed outside the UNFCCC – one of the most significant developments in recent years. This includes increased attention to climate action in other multilateral processes, such as the development of the SDGs (which include a proposed goal on climate change as well as others related to it), discussions on Financing for Development, and under the G7 and G20. But it also goes well beyond these intergovernmental processes. Multi-stakeholder initiatives have been launched on renewable energy, energy efficiency, transport, cities, agriculture, forests, short-lived climate pollutants, finance and adaptation, among others.83 Many of these were showcased at the UN Climate Summit in New York in September 2014, an unprecedented gathering of government, business and civil society leaders.84
At the Lima Climate Change Conference in December 2014, the Governments of Peru and France, in association with the UN Secretary General and UNFCCC Secretariat, launched the “Lima-Paris Action Agenda”, aiming to provide a platform for multi-stakeholder climate solutions at the Paris conference.85 The UNFCCC Secretariat has established a portal where actions by non-state actors and international cooperative initiatives are registered and recognised, backed by an independently compiled database.86 Serious efforts are now being made to produce methodologies by which these actions can be properly measured and assessed.87
Many of these initiatives are relatively new and still in development, however, and participation remains relatively narrow. A major expansion of cooperation is both possible and vital, if the full range of opportunities for growth-enhancing climate action are to be realised. This report in particular highlights 10 areas of international and multi-stakeholder cooperation with significant potential. In some, there are already initiatives with considerable momentum, but which need wider participation to have significant impact. Others represent opportunities that have yet to be seized. The initiatives fall into four broad categories:
The areas identified in this report do not exhaust the full range of available opportunities for partnership or cooperation. But in each of them cooperative action could generate significant economic benefits and emission reductions – and there is potential for key commitments to be made this year or next. The first criterion is critical: in each case, there are powerful reasons for governments, cities, businesses and others to work together to implement the proposals, even without consideration of their climate impact. They will have economic benefits – both in terms of growth, employment and poverty reduction, and more broadly through improved air quality and public health, reduced congestion, improved quality of life, and more. In short, they can help generate “better growth” as defined in Better Growth, Better Climate.
The analysis here has also estimated their climate benefits, where possible. The methodology and numbers are explained in a separate Methodology Note.88 It is of course not the international cooperation itself which has the mitigation potential; it is the policies and investments themselves. But cooperative partnerships can help catalyse and support that action. Some of the actions overlap with one another in terms of their impacts on emissions; these have been subtracted to arrive at the total potential.
Overall, if the recommended actions were implemented, the analysis suggests that global GHG emissions in 2030 would be 16–26 Gt CO2e lower than under a “business as usual” scenario, i.e. if current trends were to continue with no new policies introduced. This represents between 59% and 96% of the reductions likely to be needed by 2030 to put the world on a pathway consistent with holding global warming to 2°C (see Figure 4).89
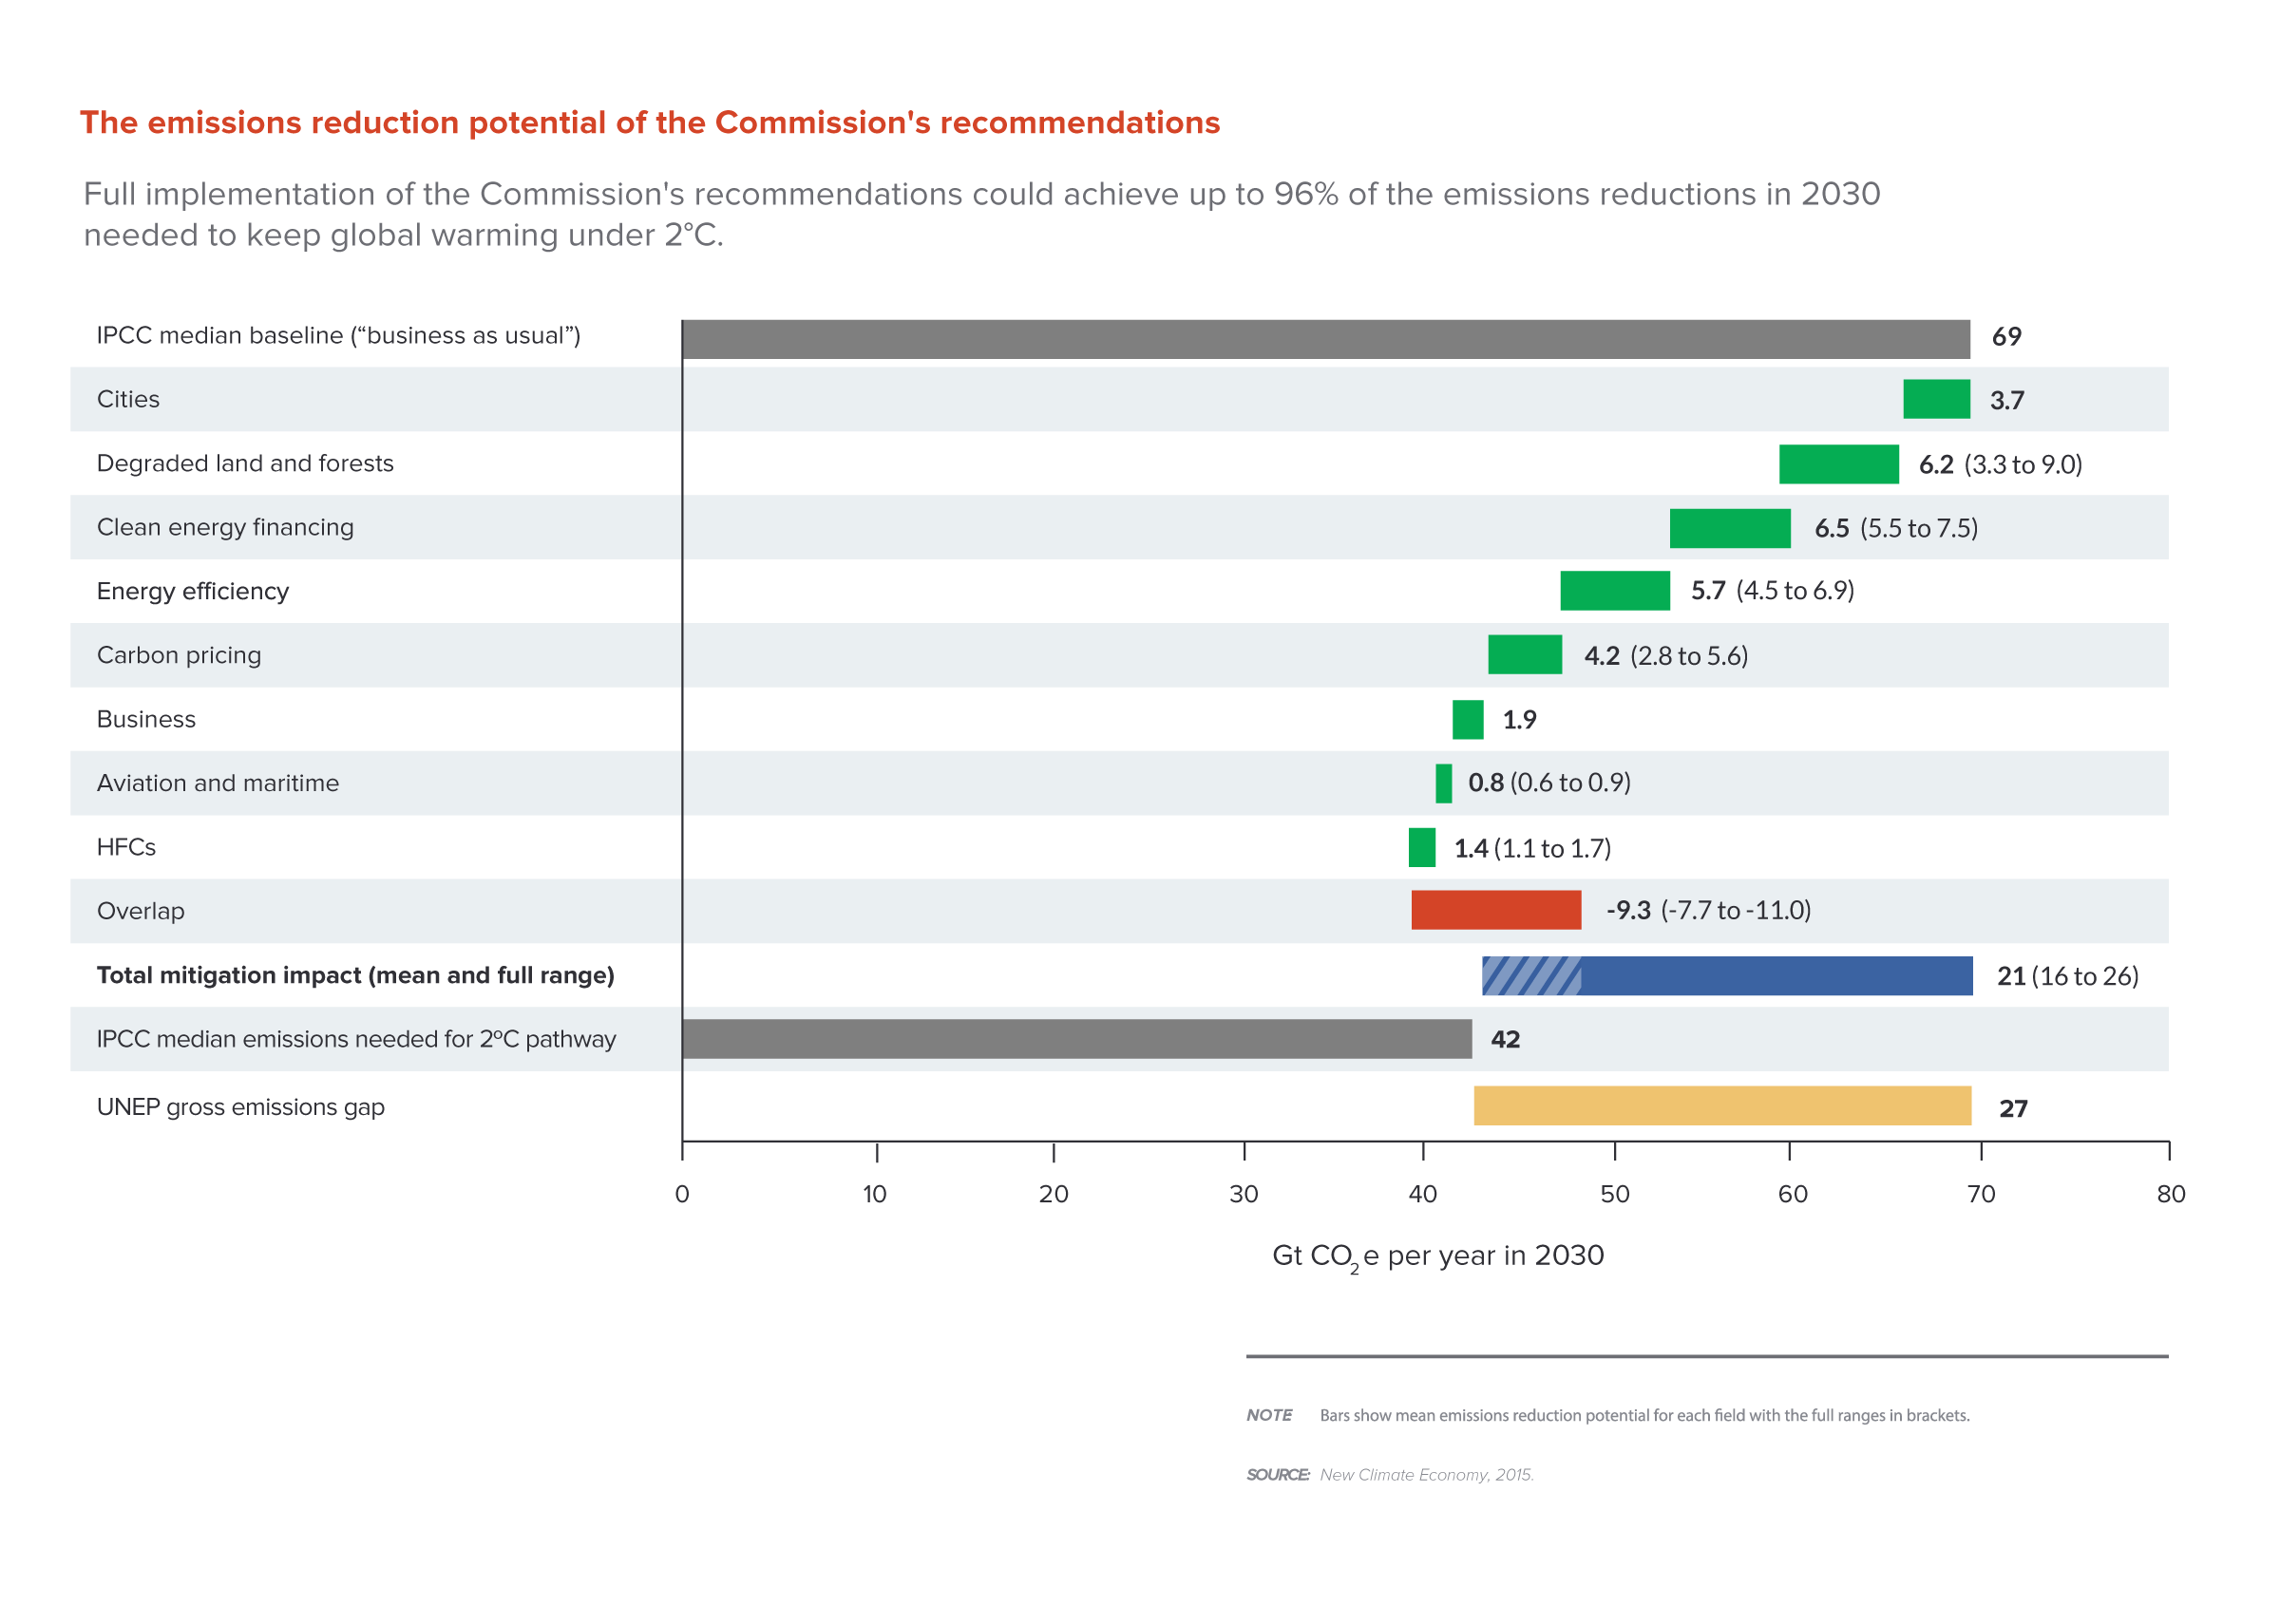
Figure 4: The Commission’s recommendations could achieve up to 96% of emissions needed to keep climate change under 2°C. Source: New Climate Economy analysis.90
This shows that the emissions reductions envisaged in INDCs are only a fraction of the economically beneficial options for climate mitigation possible over the next 15 years. This is not surprising, as INDCs generally reflect what countries believe they can achieve on their own, “nationally determined”. Enhanced action by a variety of other stakeholders and through international cooperation can enable them to do more.
This does not mean that the emissions reduction potential from these cooperative initiatives would all be “additional” to the commitments in the INDCs (except in international aviation and shipping, where emissions are not included in national inventories). Rather, insofar as countries are not yet planning to pursue the actions recommended here, the analysis indicates the potential to raise national commitments in the future. Multi-stakeholder action and international cooperation can thus help governments achieve considerably more mitigation than they now see as feasible.
In this sense the Paris climate conference, building on the Financing for Development and Sustainable Development Goal conferences earlier in the year, creates a much broader opportunity to promote action for growth and climate. Nationally determined commitments will be the bedrock of the new international agreement. But as this report shows, national action can be supplemented, in Paris and beyond, by many forms of international and multi-stakeholder cooperation. In all the fields outlined in this report, governments, states and regions, cities, businesses, and international and civil society organisations have the opportunity to bring forward new commitments to driving low-carbon and climate-resilient growth. These have the potential to enable countries to reduce emissions much further than they can on their own. They can bring the world as a whole much closer to the 2°C pathway. And they can bring all countries the benefits of stronger economic performance, development and poverty reduction.

We live in an urban era. Cities are growing at an unprecedented rate, particularly in the developing world, with 1.4 million people added to urban areas each week. By 2030, around 60% of the global population will live in cities. Cities are engines of economic growth and social change, expected to produce about 85% of global GDP in 2015 – and they generate 71–76% of energy-related global greenhouse gas (GHG) emissions. With their dense populations, concentrations of property and infrastructure, and large paved areas, cities are also particularly vulnerable to floods, storm surges and other climate impacts, particularly in coastal regions and along rivers.
All these factors make it crucial to ensure that the infrastructure investments made in cities in the next several years are both low-carbon and climate-resilient. As shown in Better Growth, Better Climate, cities have much to gain from adopting more compact, connected and efficient forms of development: greater economic productivity and appeal to investors, improved air quality and public health, reduced poverty and enhanced safety, and substantial avoided infrastructure and public service costs. For urban leaders, low-carbon strategies are thus as much about building healthier, more liveable and more productive cities as about reducing GHG emissions.
We live in an urban era. Cities are growing at an unprecedented rate, particularly in the developing world, with 1.4 million people added to urban areas each week. By 2030, around 60% of the global population will live in cities.91 Cities are engines of economic growth and social change, expected to produce about 85% of global GDP in 201592– and they generate 71–76% of energy-related global greenhouse gas (GHG) emissions.93 With their dense populations, concentrations of property and infrastructure, and large paved areas, cities are also particularly vulnerable to floods, storm surges and other climate impacts, particularly in coastal regions and along rivers.
All these factors make it crucial to ensure that the infrastructure investments made in cities in the next several years are both low-carbon and climate-resilient. As shown in Better Growth, Better Climate, cities have much to gain from adopting more compact, connected and efficient forms of development: greater economic productivity and appeal to investors, improved air quality and public health, reduced poverty and enhanced safety, and substantial avoided infrastructure and public service costs. For urban leaders, low-carbon strategies are thus as much about building healthier, more liveable and more productive cities as about reducing GHG emissions.
Mayors and local authorities increasingly recognise the economic and other benefits of climate action, and many are not only demonstrating leadership by taking action in their own cities, but engaging their peers and working to raise ambition through groups such as the C40 Cities Climate Leadership Group, Local Governments for Sustainability (ICLEI) and United Cities and Local Governments (UCLG). Members of these networks have already agreed to commitments equivalent to 0.4 Gt CO2 in annual emission reductions by 2030.94 And momentum is growing.
At the UN Climate Summit in 2014, urban leaders formed a new “Compact of Mayors” committed to tracking and reducing GHG emissions under a common accountability framework, while also making their cities more resilient.95 As of June 2015, 80 cities have signed on, and many more are expected to join. The Compact builds on existing initiatives, such as the Covenant of Mayors in Europe, whose more than 6,000 signatories have set emission reduction targets and adopted sustainable energy action plans to help meet them.
But action needs to be scaled up and accelerated. Many cities, particularly in developing countries, need support from national and international institutions to transition to low-carbon development models. National policy is critical, generally determining the powers and financial resources available to city authorities. Regional and provincial governments can also play crucial roles – particularly as many are leading low-carbon action themselves, including through their own international Compact of States and Regions formed in 2014.96 At all levels, policy and finance environments need to shift quickly and significantly to help cities, states and regions change course.
New analysis undertaken for this report shows that low-carbon urban actions represent a US$16.6 trillion global economic opportunity.97 This analysis builds on a 2014 study for the UN Special Envoy for Cities and Climate Change and C40, which found that 11 key low-carbon measures in the buildings, transport and waste sectors, where cities have the greatest power to take action, could generate annual savings of 3.7 Gt CO2e in 2030 and 8.0 Gt CO2e in 2050.98
The largest 500 cities by population could contribute annual savings of 1.65 Gt CO2e by 2030, nearly half the identified urban mitigation potential.99
To evaluate the economic case for large-scale deployment of these measures, the New Climate Economy assessed the incremental costs that cities would face if they implemented them instead of their higher-carbon equivalents. The costs were then compared with the savings these measures would generate up to 2050 through reduced energy demand, relative to business as usual.100
The analysis was deliberately conservative, excluding savings that would accrue beyond 2050 and presenting only direct cost savings, not wider social, economic and environmental benefits.
Even so, the analysis makes a compelling economic case for significant low-carbon investment in cities. In the central scenario, these measures would cost US$977 billion per year on average globally in 2015–2050, but they would reduce annual energy costs by US$1.58 trillion in 2030 and US$5.85 trillion in 2050. Thus, collectively, the investments would pay for themselves within 16 years. In this scenario, the net present value (NPV) of the savings generated for cities in 2015–2050 would be US$16.6 trillion. It is important to note, however, that not all low-carbon investments will have a positive NPV, and some may also involve significant opportunity costs.
The returns would be even greater with wider policy action. With higher energy prices through fossil fuel subsidy reform and carbon pricing, together with enabling policy interventions, such as support for low-carbon innovation, the NPV of the stream of savings that the investments would generate could rise to US$21.86 trillion through 2050 (under a discount rate of 5%), which offers substantial scope to secure private-sector investment. In a scenario with lower energy prices and slower technological learning, this bundle of measures would still have a positive NPV of US$4.85 trillion with a real discount rate of 3%.
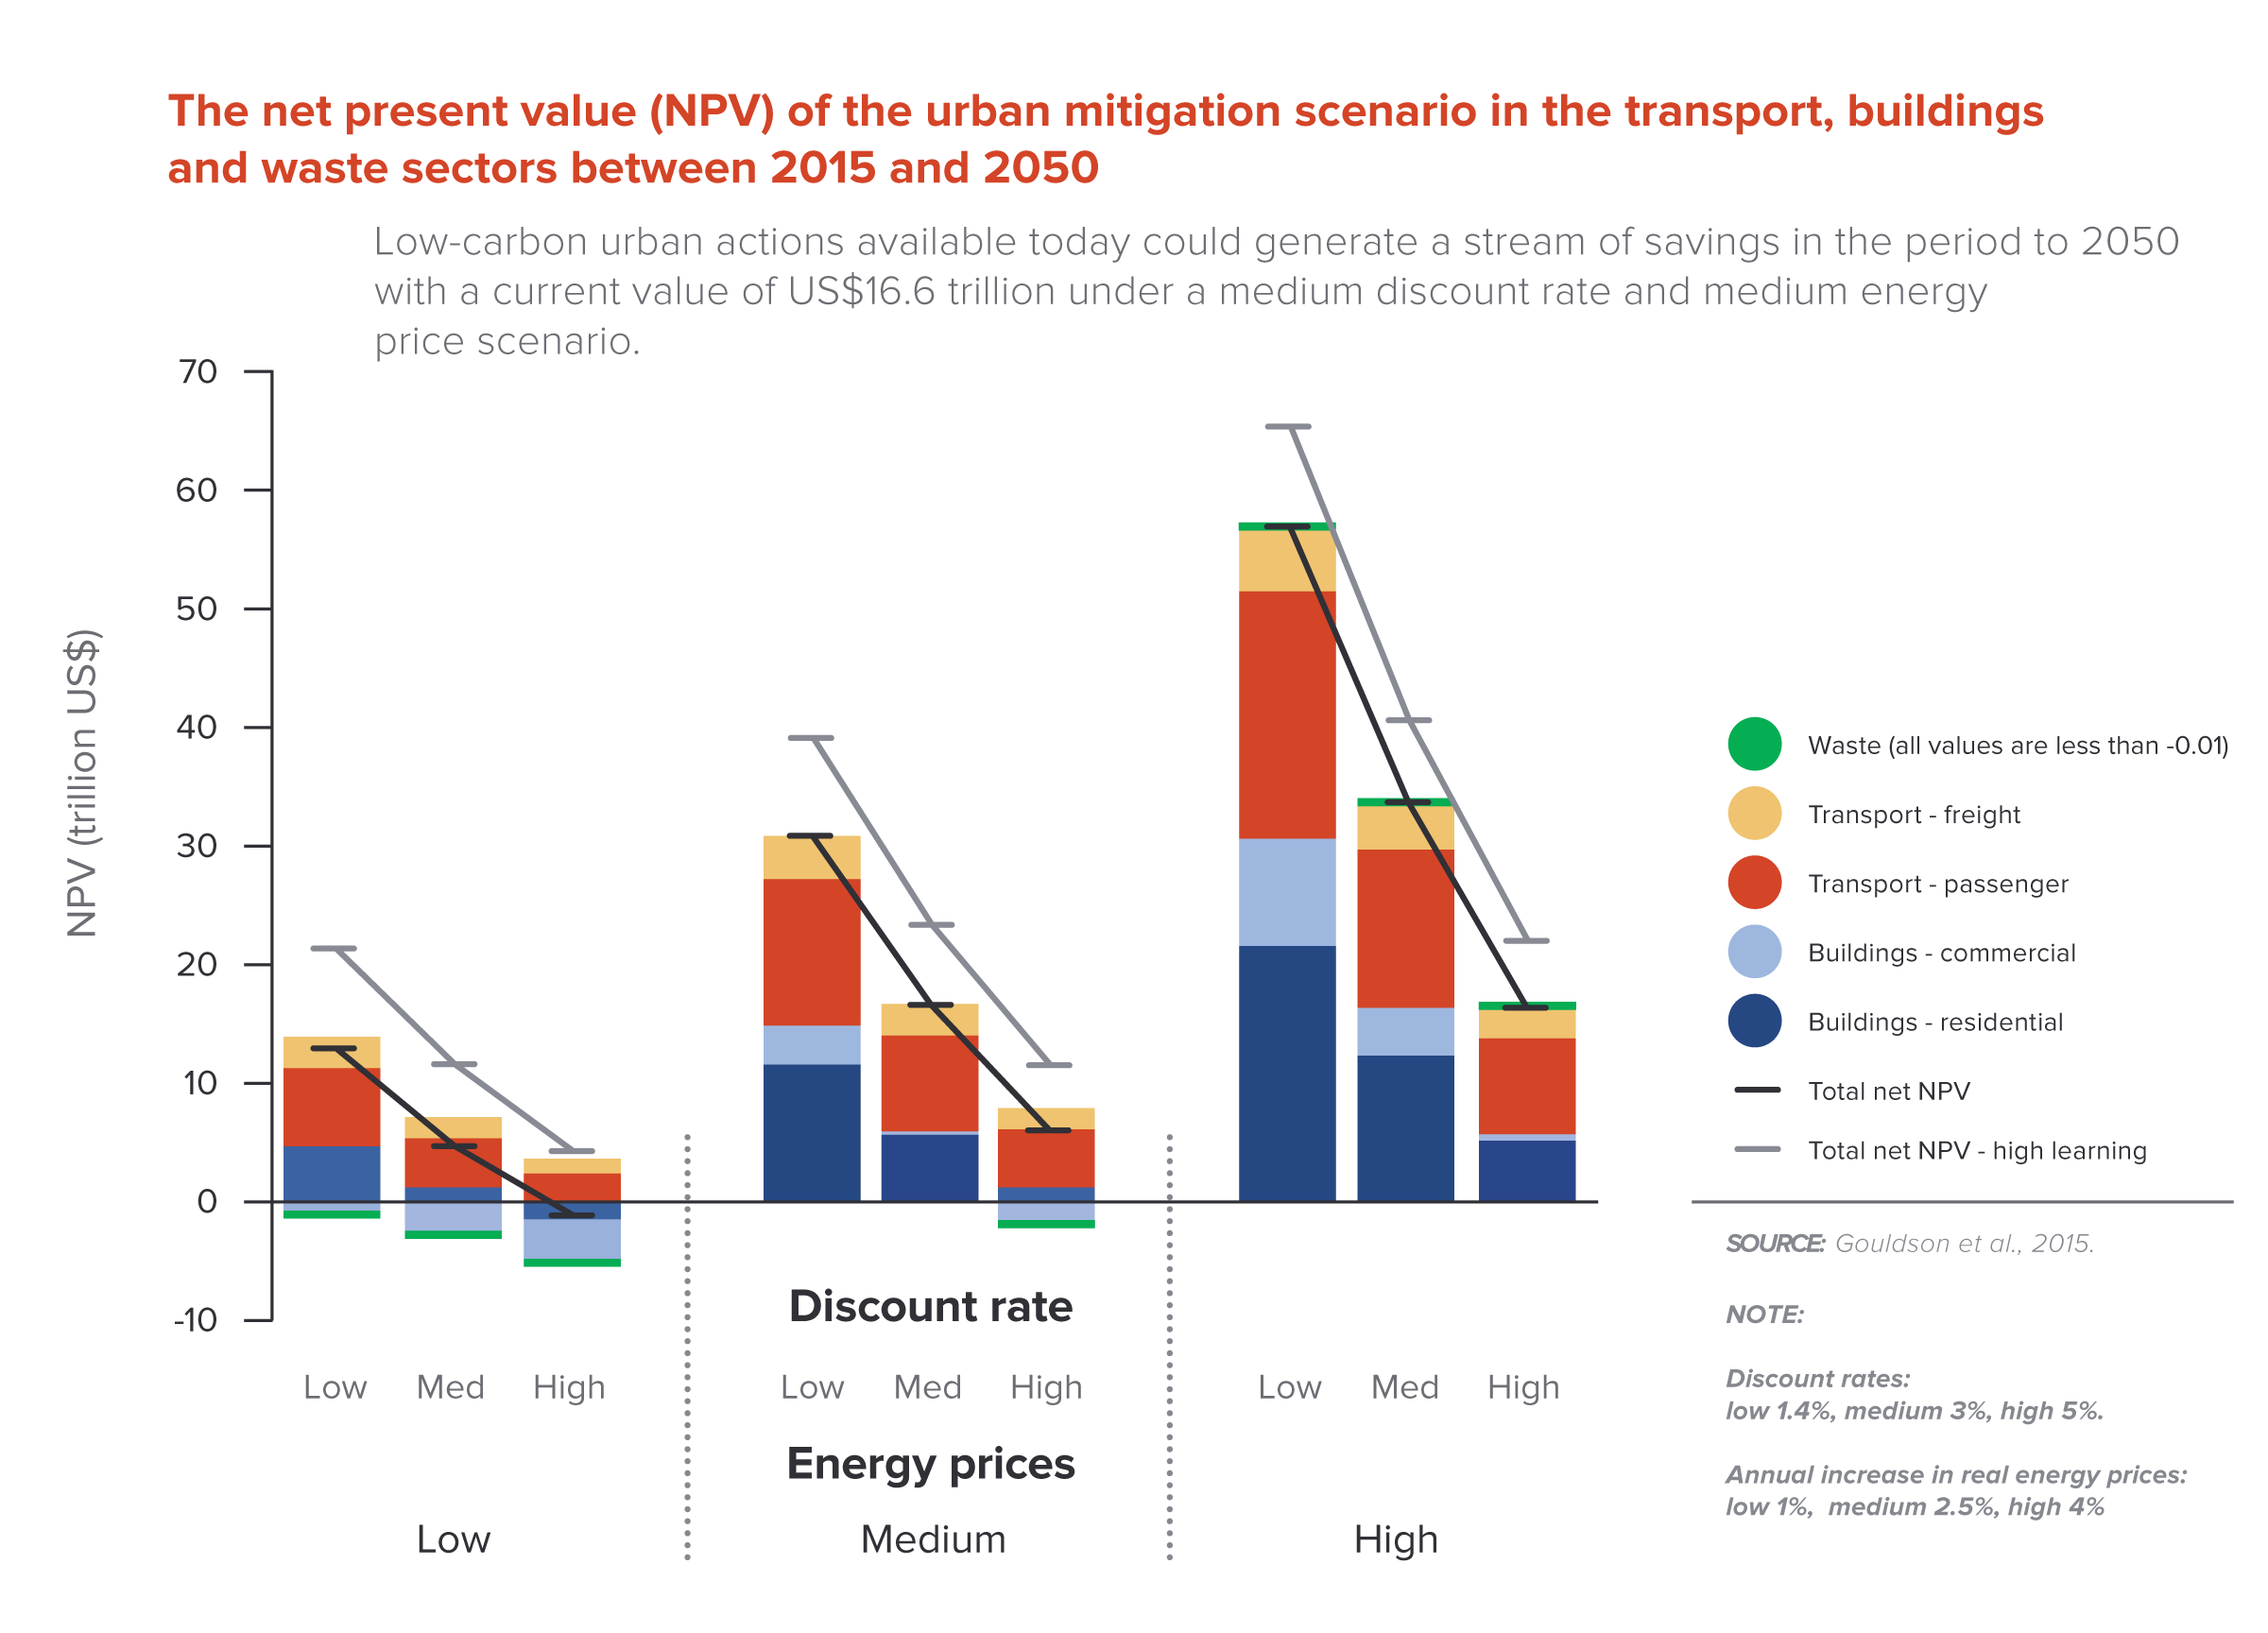
Figure 5. The net present value (NPV) of the urban mitigation scenario in the transport, buildings and waste sectors between 2015 and 2050101 Source: Gouldson et al., 2015.102
Yet the benefits of low-carbon investment go far beyond direct cost savings. Making cities more compact, connected and efficient can generate sustained urban productivity improvements and a wide range of economic, social and environmental benefits. The goal is to manage urban expansion to encourage dense, transit-oriented and liveable urban forms, and to unlock agglomeration effects and networking advantages. Such an approach could help to avoid the extensive traffic congestion that is causing serious social and economic costs in cities throughout the world, and to reduce the traffic accidents that kill around 1.25 million people annually, over 90% of them in developing countries.103 It could also significantly reduce the cost of providing services and infrastructure for public transport, energy, water and waste. Analysis for Better Growth, Better Climate showed that compact, connected urban growth could reduce global infrastructure investment requirements by more than US$3 trillion in 2015–2030.104
Case studies of low-carbon urban actions around the world – in both developed and developing countries – show they can yield multiple benefits beyond direct energy and GHG savings. There are a growing number of success stories involving “green buildings” and energy efficiency standards for new construction, as well as for retrofits of existing buildings. Many cities are also expanding and improving mass transit, embracing bus rapid transit (BRT) in particular, which costs, on average, one-tenth as much as metro rail transit.105 Infrastructure that makes cycling easier and safer improves public health by promoting physical activity and reducing air pollution and vehicle accidents.106 Moreover, cycling is a low-cost option that can enhance mobility for the urban poor.107 Cities are also discovering the benefits of building distributed energy systems based on small-scale renewables, particularly as costs have dropped sharply in recent years.
International cooperation can encourage cities to raise their ambitions, and enables them to track their progress towards low-carbon goals. Not enough cities have prepared credible emission inventories or made firm emission reduction commitments, and few have long-term targets, which are crucial to sustaining emission reductions over time. Through international cooperation, standardised methodologies are being developed and implemented that may also help cities to access technical and financial assistance from international financial institutions. In turn, new international initiatives promoting common platforms for action such as the Compact of Mayors can help to promote a “race to the top”, with cities competing for capital by using low-carbon strategies to boost their appeal to investors.
International cooperation can also play a critical role in equipping cities with the knowledge and skills to understand the science, economics, policy options and business models they need to identify and implement suitable low-carbon measures. Only about 20% of the world’s 150 largest cities have even the most basic analytics needed for low-carbon planning.108 International organisations such as UN Habitat and the international city networks can help to address skills gaps at the local level by training municipal staff and political leaders, particularly in emerging and developing economies. The Habitat III Conference in October 2016 will be an opportunity to discuss and learn lessons from cities, towns and villages around the world on how to achieve sustainable urban development and to identify emerging challenges.
Moreover, international institutions can help cities build institutional capacity, for example by helping to establish integrated municipal authorities to address cross-cutting challenges such as effective land use and transport planning.109 They can support national and provincial as well as local decision-makers by providing climate-relevant data at the city scale. And they can help cities overcome the huge financial constraints many face in identifying, developing and implementing “investment-ready” programmes or projects that can attract private investment, and helping them to improve their creditworthiness. According to the World Bank, only 4% of the 500 largest cities in developing countries are deemed creditworthy in international financial markets, and investing US$1 to boost a city’s creditworthiness can leverage more than US$100 in private finance.110 Finally, international institutions can help national governments to recognise the critical role that cities play in a country’s development, empower them to take action and attract investment, and support them through national policies.
The economic case for low-carbon urban development is compelling, and international cooperation, led by nations and cities and supported by international organisations, can amplify and accelerate action.
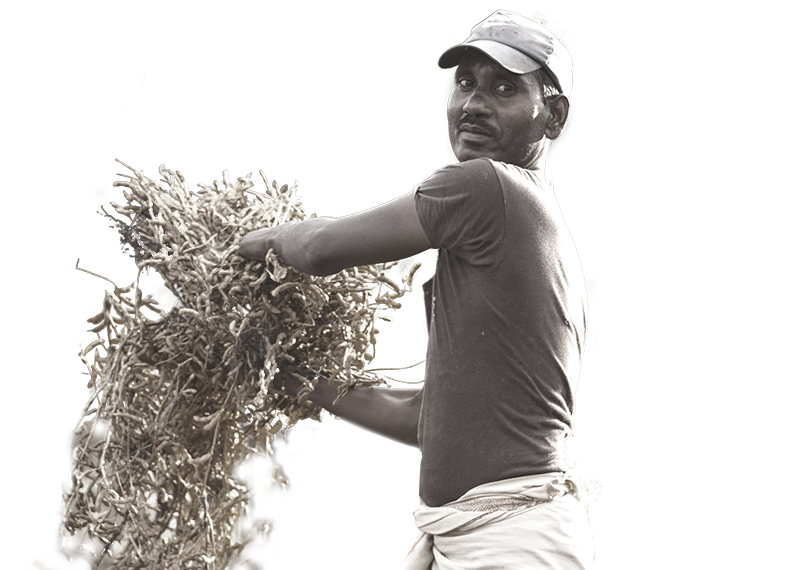
Global demand for agricultural and forestry commodities – food, fuel, fibre and timber – is rising rapidly, primarily in emerging and developing economies. This creates vital opportunities for economic growth, but it also puts pressure on natural resources. With the global population expected to grow by 1.2 billion by 2030 – and the global middle class to roughly double by 2030 – that pressure will only increase. About 70% more food calories will need to be produced by 2050, while demand for wood products will increase three- to fourfold.
Countries face the simultaneous challenges of raising agricultural and forest productivity, preventing deforestation, improving the governance of natural resource use, and strengthening the resilience of land use systems to climate change and other threats. As argued in Better Growth, Better Climate, the linkages between these challenges require a holistic approach. Unless they are addressed together, fixing problems in one area will just shift them to others.
Global demand for agricultural and forestry commodities – food, fuel, fibre and timber – is rising rapidly, primarily in emerging and developing economies. This creates vital opportunities for economic growth, but it also puts pressure on natural resources. With the global population expected to grow by 1.2 billion by 2030 – and the global middle class to roughly double by 2030 – that pressure will only increase.114 About 70% more food calories will need to be produced by 2050, while demand for wood products will increase three- to fourfold.115
Countries face the simultaneous challenges of raising agricultural and forest productivity, preventing deforestation, improving the governance of natural resource use, and strengthening the resilience of land use systems to climate change and other threats. As argued in Better Growth, Better Climate, the linkages between these challenges require a holistic approach. Unless they are addressed together, fixing problems in one area will just shift them to others.
Agriculture and land use change, including change through deforestation, account for roughly a quarter of global GHG emissions. Both agriculture and forests are also already feeling the impact of climate change. Reducing emissions and increasing resilience while boosting productivity will require strong national policies and scaled-up international and multi-stakeholder partnerships to support them.
Better Growth, Better Climate examines multiple opportunities for public policy and land use practices to boost productivity and resilience while reducing emissions. This includes both supply-side measures, such as the use of new crop varieties and new techniques of livestock management, and demand-side measures, such as reducing food loss and waste. This report focuses on two critical areas that require much greater international cooperation, involving both public and private actors: investments to restore degraded agricultural and forest landscapes, and international finance to halt and reverse deforestation, supported by commodity supply-chain commitments.
A quarter of the world’s agricultural land is severely degraded,116 primarily in developing countries, and another 12 million hectares are lost each year due to poor soil and water management and other unsustainable farming practices.[117 The UN estimates that degradation of agricultural landscapes cost US$40 billion worldwide in 2014, not counting the hidden costs of increased fertiliser use and loss of biodiversity and unique landscapes.118
At the same time, 13 million ha of forest are being cleared each year.119 About 30% of global forest cover has been cleared,120 and over a quarter is degraded; only 21% remains intact.121 The expansion of agriculture has played a key role in this. Global agricultural land area, including permanent pastures, grew by about 10% or 477 million ha in the 50 years up to 2013.122 In the past decade, most of the forest loss has occurred in the tropics, with commercial agriculture responsible for 71% of tropical deforestation worldwide in 2000–2012, much of it illegal.123 Wood and pulp production and, in some places, mining have also contributed to natural forest loss and degradation.
The environmental and economic impact of these trends is enormous. In 1990–2010, carbon storage equivalent to about 15% of manmade global GHG emissions was lost each year.124 Vital ecosystem services have been compromised. The ecosystem services provided by forests, including pollination and regulation of water flows that support nearby agricultural productivity, have been estimated at US$3,100–6,120 per ha per year. This implies an additional cost of annual gross deforestation of US$40–80 billion.125
These trends can be reversed. Brazil has slowed deforestation by 70% since 2005, through a combination of economic incentives and law enforcement. Indonesia has extended its moratorium on new concessions for the conversion of primary forests. From China to Niger, landscape restoration projects using a variety of approaches, including “climate-smart agriculture” techniques such as no-till farming and agroforestry, are stopping erosion, re-greening land and restoring tree cover. These efforts are raising the incomes of agrarian and forest communities, boosting the productivity and resilience of land, and cutting net emissions. They are mutually supportive, making it critical that public policy reforms by national governments support the management of landscapes as a whole.
If these successes are to be scaled up, however, national policy in many countries will need to be supported by strong international cooperation. There is great momentum already. More than 175 governments (from tropical forest-rich countries and elsewhere), companies, civil society institutions and indigenous peoples’ groups have endorsed the New York Declaration on Forests launched at the UN Climate Summit in September 2014. They pledge to work together to cut natural forest loss in half by the end of the decade, end it entirely by 2030, and restore more than 350 million ha of forests by 2030.126
The Global Alliance for Climate-Smart Agriculture (GACSA) was also launched at the Summit, the result of three years’ collaboration to increase investment in agricultural productivity and resilience and help reduce agriculture’s large carbon footprint.127 The revamped Consultative Group on International Agricultural Research (CGIAR) and the new Global Research Alliance on Agricultural Greenhouse Gases are helping to advance and accelerate crucial research.128And other initiatives are emerging, such as the business-led Low-Carbon Technology Partnership initiatives on forests and on climate-smart agriculture under the World Business Council on Sustainable Development (WBCSD).
Prominent regional initiatives are also making an impact. The Africa Climate-Smart Agriculture Alliance (ACSAA) aims to see 6 million smallholder farms in Africa practising CSA within seven years.129 Initiative 20×20 in Latin America and the Caribbean, launched at the Lima Climate Change Conference in December 2014, set out to initiate restoration of 20 million ha of degraded agricultural and forest land by 2020. So far nine Latin American and Caribbean countries and two regional programmes have committed to restoring more than 21 million ha, and more commitments are expected.
Leading businesses are also now working to ensure more socially and environmentally sustainable practices.130 Members of the Consumer Goods Forum (CGF), an industry association representing companies with more than US$3 trillion in annual revenue, pledged in 2010 to eliminate deforestation from their supply chains by 2020.131 In 2012, members of the CGF, including Unilever and Nestlé, partnered with a number of tropical forest countries and other governments, as well as environmental and other civil society organisations, to form the Tropical Forest Alliance 2020 (TFA 2020), a multi-stakeholder platform to eliminate deforestation from global commodity markets.132 Several major commodities traders – including Wilmar and Cargill – have now joined them. Overall, company commitments now cover more than 90% of the global palm oil supply chain.133
These efforts are being supported by new technologies and tools that enable radical transparency in monitoring progress, for example Global Forest Watch, which provides near real-time data on tree cover change. By working together, governments, consumer goods companies, local producers, civil society organisations and communities have the potential to achieve change which would have been beyond any of them working on their own. The key now is to translate pledges into effective actions – from economic incentives, to effective monitoring of suppliers and improved transparency in supply chains. It is also critical to establish comparable commitments and partnerships in other commodities affecting forests, notably soy, beef and pulp and paper.
One of the greatest challenges is how to pay for large-scale restoration of agricultural land and forests. Human-caused degradation of whole landscapes today is mainly a challenge in developing-countries.134 Governments in these countries often lack the resources to stop degradation, much less to restore land. And while commercial-scale operations are often the culprits, smallholders are also involved, and they have limited capital. Moreover, although farmers can benefit from restoration and investments in more sustainable management, through increased crop yields or new forest products to sell, some of the biggest benefits, such as better water retention, cleaner and more plentiful water supply, cleaner air, higher biodiversity and better pollination, are public goods that cannot be monetised easily by farmers and landowners.
Current global investment from all sources, public and private, in restoration and conservation of mixed landscapes is estimated at US$50 billion per year, of which about half is in emerging and developing countries.135 On the other hand, global needs for investment in conservation and restoration have been independently estimated at US$200–300 billion per year.136 This leaves an estimated shortfall of about US$150–250 billion per year. There is a pressing need to scale up both public and private investment, domestic and international, to fill this gap.
Official development assistance and existing private direct foreign investment in agriculture and forest-related activities in developing countries is currently less than US$7 billion per year.137 Thus, most of the needed new investment will have to come from domestic sources and greatly expanded investment from the international private sector. The latter is likely to involve “impact investing” – private (typically internationally active) investors seeking to achieve social and/or environmental impacts along with financial returns.138 Impact investing for landscape conservation and restoration is expected to reach at least US$6 billion total in 2014–2018, triple the level of the previous five years.139 But much more finance is needed, and key barriers need to be overcome to ensure a good supply of deals with adequate collateral, sufficient prospects for future cash flow, and acceptable risk-reward profiles. Strong domestic policy frameworks aimed at addressing the key market and governance failures which help drive unsustainable land use practises – from agricultural input subsidies to inadequately defined and defended property rights – are crucial.
Several further elements will be needed to overcome financing barriers to scale up private investment: capacity-building, concessional bridge funding for project start-ups, and catalytic first-loss equity investment, which can all be funded by targeted multilateral public and philanthropic cooperation. More public and private impact investment, and partnerships between them, will be needed to have results at scale.
To reduce financial risks, “capital stacking” could play an important role. This is a common risk-sharing approach in which institutional or philanthropic investors typically provide first-loss equity, impact investors provide preferred equity, and other private investors provide protected debt equity. Publicly-funded institutional investors may be able to leverage private capital on as much as a 10:1 basis by accepting a 10% first-loss for being the junior equity partner in a stacked capital deal.140 The evidence suggests that pooling risks across institutional investors and developing expertise within one facility can lead to cost savings. Public investments will also be needed for capacity building and to underwrite start-up costs, especially in the case of smallholders. This approach is likely to be most fruitful when it is part of a broader unified approach, such as land restoration across a given region.
Another key area for enhanced cooperation is REDD+: reducing emissions from deforestation, forest degradation, conservation, sustainable management of forests and enhancement of forest carbon stocks. REDD+ is a system whereby forest countries make domestic commitments to maintain more forests, and are then supported by developed countries. International assistance can help forest countries develop strategies and build capacity to implement national policies and develop projects to reduce emissions. Those able to deliver deforestation reductions – and reliably measure, report and verify them – can enter into carbon finance agreements with advanced economies and multilateral development banks, with a “results-based payment” for emission reductions below the agreed reference level.141
Results-based REDD+ works most efficiently and equitably when strong governance is in place, including clear land rights, effective land use planning and strong law enforcement. Where there is political commitment to reduce deforestation, early direct investments can help to build these critical capacities and systems. Results-based payments are not the only option, and some forest countries and donors may choose other approaches. However, results-based REDD+ schemes are inherently efficient. If they fail to deliver large-scale results, the amounts paid will be much smaller. Many forest countries and subnational jurisdictions have started down this path.
Sixty-five developing countries have joined either (or both) the UN-REDD+ Programme or the World Bank’s Forest Carbon Partnership Facility (FCPF), 54 of which have had plans approved for funding.142 Funders are also stepping up, making funds for REDD+ readiness and results-based-payments increasingly available. The Green Climate Fund will be able to provide payments for REDD+ results through the UNFCCC process (as reflected in the Warsaw Framework for REDD+). Between 2008 and the end of 2014, US$2.8 billion had been pledged to five multilateral funds that support REDD+, with an increase of two-thirds in the value of overall project approvals since November 2013.143 REDD+ agreements can also spur enhanced national action: a pledge of US$1 billion from Norway to Indonesia, for example, has supported the moratorium on clearing forests, and a mapping initiative to clarify property rights that has exposed significant overlapping and illegal forest holdings. This unprecedented transparency is helping to pave the way for private sector commitments.144
All these efforts are closely interlinked, and need to be addressed cooperatively to achieve synergies and avoid conflicts. For example, boosting agricultural productivity could lead to increased deforestation on adjoining lands if protection of forests is not simultaneously enforced. Similarly, forest protection in one area can simply shift deforestation to another. Yet at the same time, climate-smart approaches such as agroforestry can add tree cover while also boosting food production. Deforestation-free supply chain efforts combined with REDD+ can also dramatically change economic incentives for farmers. Most importantly, a coordinated, integrated national approach to landscape management is needed which aims simultaneously to address resource conservation and restoration, boost the productivity of land, and promote rural economic development and poverty reduction.
Collectively, we estimate that these efforts can lead to emission reductions of 3.3–9.0 Gt CO2e in 2030 while making agriculture more productive and resilient, and boosting the incomes of agrarian and forest communities in developing countries.
Clean energy investment has grown rapidly in recent years: US$270 billion was invested in renewables in 2014, and at least US$130 billion in energy efficiency. In 2013, for the first time, the world added more low-carbon electricity capacity than fossil fuel capacity. The costs of low-carbon technologies continue to fall, and new finance vehicles are starting to take off: issuances of “green bonds”, for example (which go beyond just clean energy) tripled within a year, to US$36.6 billion in 2014.
The case for large-scale clean energy investment is strong. In the next 15 years, energy demand is projected to grow by 25–35%, as up to 3 billion people enter the global middle class and world economic output doubles. About 1.3 billion people still lack access to electricity, and many more have only partial or unreliable service. But the kind of energy supply the world invests in matters a great deal. Globally, an estimated 3.7 million people die prematurely each year due to ambient air pollution, much of it related to fossil fuel combustion. CO2 emissions from fossil fuel use make up about two-thirds of global GHG emissions. For countries dependent on fossil fuels, continued oil price volatility poses significant energy security risks.
Clean energy investment has grown rapidly in recent years: US$270 billion was invested in renewables in 2014, and at least US$130 billion in energy efficiency. In 2013, for the first time, the world added more low-carbon electricity capacity than fossil fuel capacity.145 The costs of low-carbon technologies continue to fall, and new finance vehicles are starting to take off: issuances of “green bonds”, for example (which go beyond just clean energy) tripled within a year, to US$36.6 billion in 2014.146
The case for large-scale clean energy investment is strong. In the next 15 years, energy demand is projected to grow by 25–35%, as up to 3 billion people enter the global middle class and world economic output doubles.147 About 1.3 billion people still lack access to electricity, and many more have only partial or unreliable service.148 But the kind of energy supply the world invests in matters a great deal. Globally, an estimated 3.7 million people die prematurely each year due to ambient air pollution, much of it related to fossil fuel combustion.149 CO2 emissions from fossil fuel use make up about two-thirds of global GHG emissions. For countries dependent on fossil fuels, continued oil price volatility poses significant energy security risks.150
Yet about 40% of the world’s electricity still comes from coal, one of the most polluting fuels.151 And, despite rising investment in clean energy, of the US$1.6 trillion invested in the global energy supply in 2013, nearly 70% was related to fossil fuels.152 Avoiding the many negative impacts of fossil fuel use, and meeting the goal of holding global warming to under 2°C, will require a major shift in investment.
The International Energy Agency (IEA) estimates that to achieve a 2°C pathway, annual investment in low-carbon power supply – solar, wind, hydropower, bioenergy and nuclear, as well as carbon capture and storage – will need to grow to an average of about US$520 billion per year between 2014 and 2035.153 Energy efficiency investment in buildings and industry also needs to grow, to average about US$250 billion per year. In total, public- and private-sector investment in clean energy needs to reach at least US$1 trillion per year by 2030, while investment in fossil fuels, particularly coal, declines sharply.154
Such a shift is possible now, in a way that was once unthinkable, because of a dramatic reduction in the costs of clean energy technologies. Solar PV modules are about 80% cheaper than in 2008, and the cost of utility-scale solar PV has halved in four years. Solar and wind can now compete with fossil fuels with low or no subsidies in more and more places.155 Thus, while about the same amount was invested in renewables in 2014 as in 2011 (about US$270-280 billion), it bought 35% more capacity.156 At the same time, advances in smart grid, information technology systems, and energy storage technologies are beginning to make possible new ways of managing demand instead of increasing supply.157 The modular nature of solar PV also enables it to bring electricity to populations far from the grid – a major need in many developing countries. Decreasing battery costs could allow solar and other renewables to make an even greater impact, enabling electricity storage off-grid in rural areas and more efficient management of grid electricity, balancing demand and providing backup during blackouts.158
Achieving a major shift towards clean energy investment will require new policy and finance approaches. Despite recent progress, there are still technical challenges in integrating large-scale renewables into electricity grids. And there is competition from natural gas, a cheaper and often easier alternative to coal for power generation – though it also brings problems of its own.159 Fossil fuel subsidies and the lack of a carbon price in much of the world boost fossil fuels’ price advantage. And most energy markets, regulatory frameworks and business models are still designed for fossil fuel generation, and remain ill-adapted to the special characteristics of renewables and energy demand reduction.
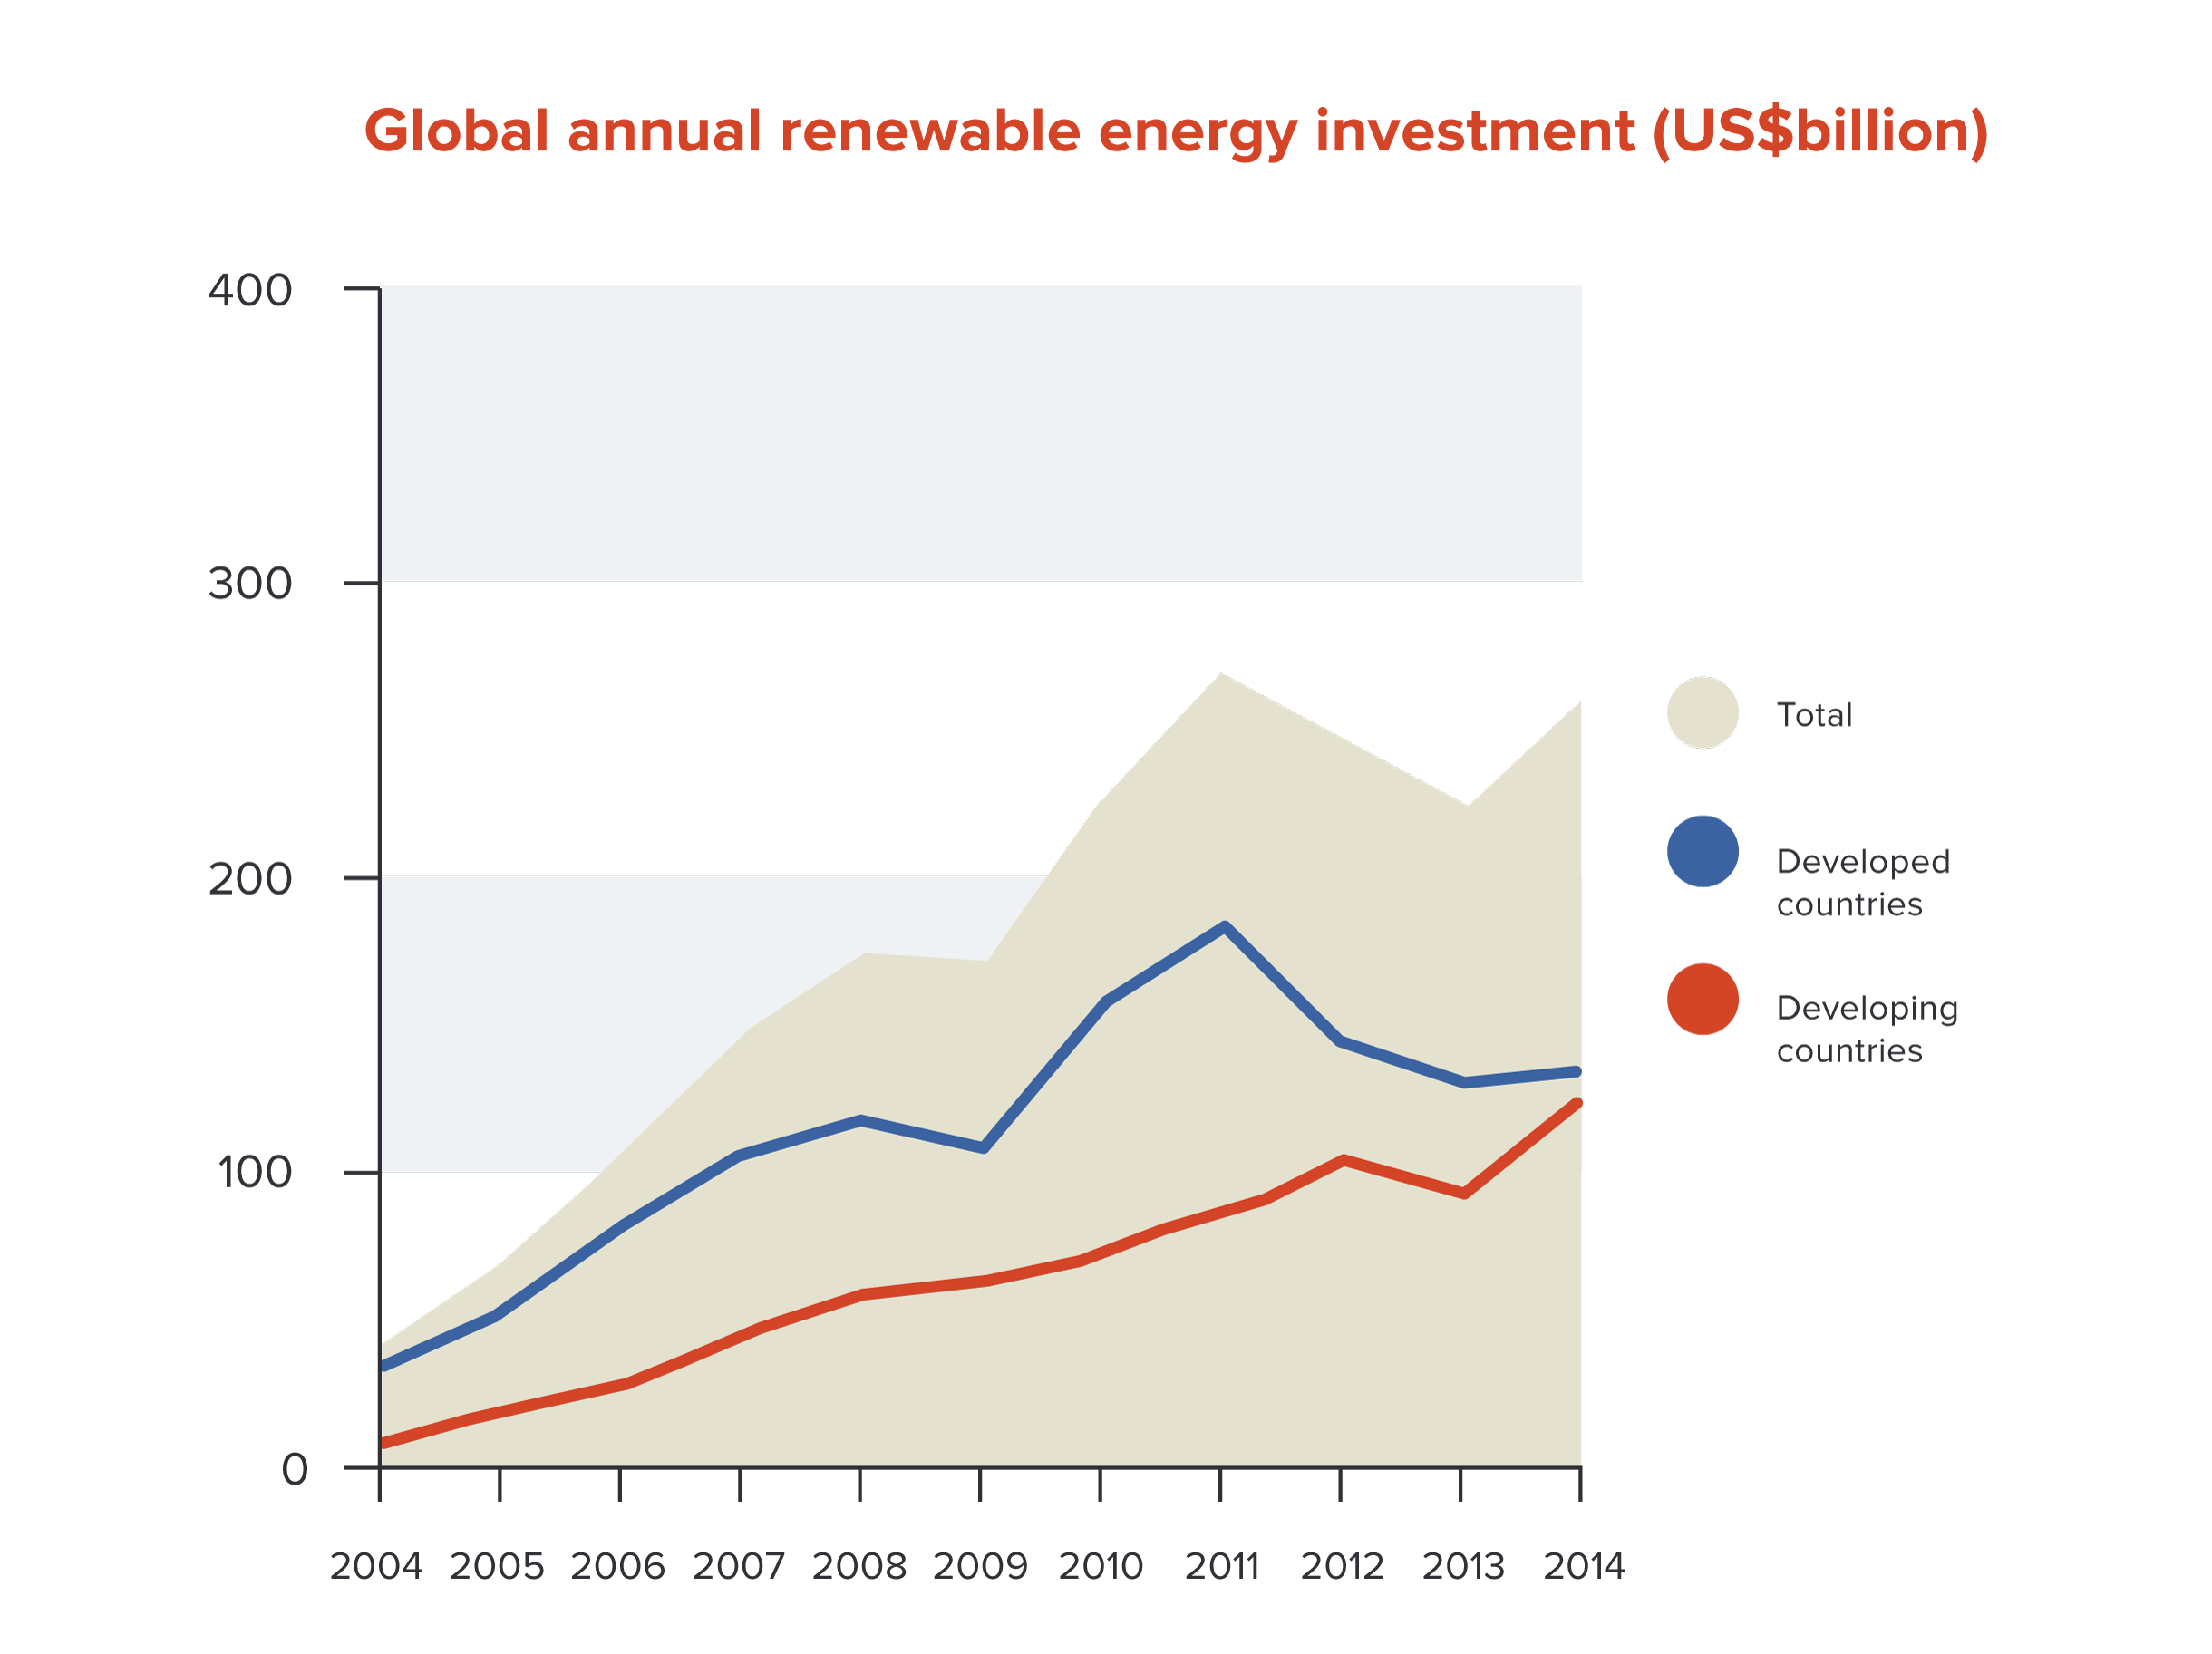
Figure 6. Global renewable energy investment, 2004–2014 Source: McCrone et al., 2015.160
There is no shortage of global capital for investment. But making clean energy projects, particularly those in developing countries, attractive to major private-sector investors will require a concerted international effort. Cooperation between the public and private sectors is needed to improve the risk-reward profile of low-carbon energy projects and thus lower the cost of capital and increase its supply. Policy actions can improve the investment environment for clean energy – for example, by ensuring non-discriminatory treatment of international investment; designing open and transparent procurement processes; improving the governance and regulatory quality of electricity markets; and coordinating the development of the electricity grid with deployment of clean energy generation.161 Institutional capacity-building is also often needed.
Projects using well-established low-carbon technologies, such as onshore wind and solar, should be low-risk investments, as they have no fuel costs and are relatively simple to operate. But today, these projects are often covered by financing and market arrangements that introduce risk, ranging from currency risk to fossil fuel price volatility, which raises the cost of capital.162 For example, renewable energy is often owned by the same investors and financed through the same structures as those for conventional energy projects, meaning that the cost of capital faced by renewables is linked to that for utilities, independent power producers and fossil fuel plants. Volatile foreign exchange rates and uncertainties around policies such as feed-in tariffs for renewable energy introduce further risk.
Measures to mitigate and reallocate risks could therefore substantially improve both the availability and the cost of capital for clean energy projects, which in turn would lower the cost of energy. Capital costs can make up 90% of the total lifetime cost of a renewable energy project; if clean energy projects could access low-cost, long-term finance reflecting their intrinsic production profile, the cost of low-carbon electricity could be up to 20% lower in developed economies and 30% in emerging economies.163 Over recent years, a number of financial instruments have been developed to mitigate and reallocate risk in these ways, including credit guarantees and currency swaps, green bonds, and investment funds such as “YieldCos”.164 These are attracting increasing private-sector interest, as investors look for long-term returns and as growing coalitions of investors seek to incorporate climate concerns into their investment strategies.165
There are now major opportunities for international cooperation to scale up efforts to improve the risk-return profile of clean energy projects. By working together at national and international levels, governments, development finance institutions and other investors such as sovereign wealth funds, together with private-sector investors, have the capacity to mobilise the US$1 trillion in annual investment that is needed.
Multilateral and national development banks have a crucial role to play.166 These development finance institutions (DFIs) committed US$126 billion of their own capital to climate-related investments in 2013, including adaptation.167 The multilateral development banks (MDBs), made up of the World Bank Group and regional development banks, provided US$24 billion of this in 2013, and US$75 billion in total in the three years from 2011.168 Among the national development banks, as of 2012, the China Development Bank had invested close to a cumulative US$80 billion in clean energy infrastructure, Germany’s KfW close to US$150 billion, and the Brazilian Development Bank (BNDES) around US$50 million.169 New DFIs based in emerging economies, including the Asian Infrastructure Investment Bank and the New Development Bank (known as the “BRICS Bank”), are also poised to become major sources of infrastructure financing.170
Given the importance of infrastructure to growth in developing countries, and the present large shortfall in infrastructure investment,171 there is a strong case for an expansion of the role of MDB finance in this field. This could include an increase in their capital funding and balance sheets, a reallocation of investment priorities, an increase in risk appetite, for example in loan to equity ratios, and stronger use of new financial instruments.172 Such reforms would enhance MDB capacity to mitigate risk and leverage greater private finance. MDBs have a particularly crucial role to play in preparing bankable projects which can attract private investment, a crucial need in many developing countries.
DFIs are also well positioned to lead efforts to strengthen international cooperation. They operate at a scale that few other actors can match, and they have experience in many roles in infrastructure finance, including making direct loans, creating targeted risk mitigation instruments and providing technical assistance. They have a key role in convening diverse stakeholders; mitigating and hedging risk; standardising data, measurement methods, projects and qualifications; providing policy support; and providing technical assistance for project development and financing. Existing activities require a concerted expansion. Cooperation among national development banks through the International Development Finance Club (IDFC)173 and the MDBs in tracking green finance and other best practices is an important start. Initiatives such as the Global Innovation Lab for Climate Finance174 offer valuable platforms for further cooperation between governments and the private sector to scale up investment.
At the same time, governments and regulators have a critical role to play in improving the risk-return profile for clean energy projects. The first step is to “level the playing field” by removing fossil fuel subsidies and implementing or strengthening carbon pricing policies. Other important mechanisms include stable clean energy subsidies and power purchase agreements that provide long-term revenue certainty for projects; designing electricity markets that do not expose low-carbon energy to fossil fuel price risk; reforming energy utilities and improving their credit ratings; and streamlining permitting and approval processes.175
Making the most of renewables to expand modern energy access, meanwhile, will require not just scaling up technologies, but also “scaling out”: financing, policies and technologies to overcome existing barriers. New finance and distribution mechanisms need to be tailored to the costs and risk profiles associated with delivering these technologies to households, small businesses and other users – from solar PV to clean cookstoves and fuels, including where grid extension may be prohibitively costly.176 New players, such as the Infrastructure Development Company Limited in Bangladesh are pioneering successful approaches. The United Nations Environment Programme (UNEP) proposal for a mini-grid pooling facility is also promising.177 A global fund for connectivity, as proposed by the African Progress Panel, could also be an effective vehicle.178
If financing for clean energy were gradually raised to a global total of US$1 trillion a year in 2030, the analysis conducted for this report estimates that the additional low-carbon power supply and investment in energy efficiency could reduce annual global GHG emissions by around 5.5-7.5 Gt CO2e in 2030.

The world’s energy systems have undergone an unprecedented expansion in the last 25 years, with energy demand growing by 50% to fuel an economy that has doubled in size. Efficiency is an essential component of any strategy to deliver affordable, reliable energy systems, with an abundance of opportunities to reduce demand and improve the use of energy resources at a lower cost than equivalent supply-side options. It is thus increasingly referred to as the “first fuel”. It can reduce the need to build new energy production infrastructure and, by reducing energy demand, it plays a key role in curbing GHG emissions from the energy sector.
Greater energy efficiency can benefit countries at all stages of development, but particularly fast-growing economies trying to achieve universal energy access with limited resources. Yet many opportunities go untapped because of misaligned incentives, lack of information and other market failures. This makes energy efficiency standards particularly important. As part of a wider policy package, they can be an effective means of changing consumer and business behaviour, and driving product innovation. International cooperation can amplify the benefits by aligning and gradually raising efficiency standards around the world. Converging towards “global best” standards in key sectors such as appliances and lighting, vehicles, buildings and industrial equipment would unlock energy and cost savings, expand global markets, reduce non-tariff barriers to trade and reduce GHG emissions.
The world’s energy systems have undergone an unprecedented expansion in the last 25 years, with energy demand growing by 50% to fuel an economy that has doubled in size.179 Efficiency is an essential component of any strategy to deliver affordable, reliable energy systems, with an abundance of opportunities to reduce demand and improve the use of energy resources at a lower cost than equivalent supply-side options. It is thus increasingly referred to as the “first fuel”.180 It can reduce the need to build new energy production infrastructure and, by reducing energy demand, it plays a key role in curbing GHG emissions from the energy sector.
Greater energy efficiency can benefit countries at all stages of development, but particularly fast-growing economies trying to achieve universal energy access with limited resources. Yet many opportunities go untapped because of misaligned incentives, lack of information and other market failures. This makes energy efficiency standards particularly important. As part of a wider policy package, they can be an effective means of changing consumer and business behaviour, and driving product innovation. International cooperation can amplify the benefits by aligning and gradually raising efficiency standards around the world. Converging towards “global best” standards in key sectors such as appliances and lighting, vehicles, buildings and industrial equipment would unlock energy and cost savings, expand global markets, reduce non-tariff barriers to trade and reduce GHG emissions.
Substantial international efforts to improve energy efficiency are already under way. The International Partnership for Energy Efficiency Cooperation (IPEEC), the Clean Energy Ministerial, the UN Sustainable Energy for All (SE4All) initiative, and the Global Best Practice Networks, among others, are providing platforms for collaboration, working to analyse energy efficiency options, to design model policies and to identify finance mechanisms. Through the “en.lighten” initiative, led by the United Nations Environment Programme (UNEP) and the Global Environment Facility (GEF), more than 60 countries have committed to reduce inefficient lighting by 2016. The Global Fuel Economy Initiative is helping more than 20 countries improve vehicle fleet efficiency. The IEA is also playing a prominent role, through its Energy Efficiency Working Party and the Energy Technology Network, which covers all sectors including its Energy Efficient End Use Equipment (4E) initiative. SE4All has identified 168 institutions and at least 145 initiatives around the world focused on energy efficiency.181
The G20, in collaboration with these major international initiatives, could provide a powerful platform for expanding and accelerating action. In November 2014, the G20 approved a plan for voluntary collaboration on energy efficiency, and IPEEC and other organisations are helping identify next steps for implementation.182 The G20 is strategically important because its members make up 80% of global energy consumption and dominate manufacturing and associated knowledge and capital. For example, 94% of vehicles are produced in G20 countries, so G20 action would have a major influence on uptake of efficient technologies worldwide.183 The G20 is thus particularly well-placed to enhance the diffusion and stringency of energy efficiency standards and raise performance in key markets. The November meeting of the G20 in Turkey offers a major opportunity to act.
Energy efficiency has huge economic value that is increasingly recognised. It can reduce fuel and energy bills, spur economic growth, and lead to reduced air pollution and GHG emissions. Modelling for the International Energy Agency (IEA) shows that the global uptake of economically-viable energy efficiency investments could boost cumulative economic output by US$18 trillion to 2035. This has been assessed in macroeconomic models to increase growth by 0.25–1.1% per year, with associated increases in employment.184 Energy efficiency increases output because it frees up resources for other, more productive investments, which is why the IEA estimates that efficiency measures yield benefits up to 2.5 times the avoided energy costs.185
Some of these gains can be offset by the “rebound effect”, whereby consumers use part of the savings to buy more energy or other energy-using goods and services. Still, the overall benefits can be substantial. Between 1974 and 2010, energy efficiency saved more energy in IEA member countries than was provided by any single supply-side resource.186 While 2010 energy use was 20% higher than in 1974, it would have doubled without energy efficiency measures. Energy efficiency is good for energy security as well. A more energy-efficient economy is less susceptible to supply disruptions or price shocks associated with volatile fossil fuel prices, and can serve to drive down energy prices.187
Finally, energy efficiency can reduce GHGs cost-effectively;188 in fact, it is crucial for tackling climate change. To stay on a 2°C path, the IEA shows the energy-intensity of GDP would need to decline by 64% by 2050,189 meaning that if economic output triples, there would only be a 20% increase in primary energy use. Of the total energy-sector GHG reductions needed by 2050 for a 2°C pathway, the IEA envisions 38% coming from improved efficiency in end uses.190 As shown in Figure 7, there is great untapped potential for energy efficiency across sectors.
Figure 7. Long-term energy efficiency economic potential by sector. Source: IEA191
Public policy has played a role in the reduction of energy-intensity of GDP observed in the last 10 years, and a clear picture is emerging of best practices. Key components of a good “policy package” to overcome market failures and other barriers include “getting prices right” for energy (e.g. through carbon pricing and phasing out fossil fuel subsidies); providing incentives for innovation; providing information to overcome habitual choices and ease decision-making; providing effective financing; and regulation through energy efficiency standards.192
Countries vary significantly in their energy productivity (GDP per unit of energy used). Some variations are due to the different sectoral make-up of economies, and levels of development,193 but the wide divergence between the stringency of energy efficiency standards is also a key factor. This means that significant economic savings are going untapped in those countries where standards are lower. Unaligned standards also add greatly to transaction costs for firms trying to sell into different national markets.
There are therefore strong economic grounds for countries to raise their standards over time, gradually converging towards the “global best”. This does not mean that all countries would have the same standards. There are likely to be differences for countries at different stages of development. Rather, the goal would be to converge toward a smaller number of standards.194 Adoption of these standards would be voluntary, and they could be applied in different ways. In some cases, countries may require all products to achieve a minimum performance level, such as for new buildings. In others, such as for domestic appliances, minimum energy performance standards can be set, but labelling products can also be important, allowing consumers to choose. The US Energy Star labelling scheme provides an example.195 Vehicle efficiency standards (such as in the US and EU) are often applied as an average across the range of models sold by individual manufacturers. In all cases an important principle is that standards should be subject to continuous improvement – the “global best” is not a static concept but a constantly evolving one. Japan’s “Top Runner” approach for appliances, for example, achieves this by basing future minimum standards in a given product class on the highest level of energy efficiency currently available.196
Any design process for convergence will need to include strong coordination between relevant governments, best practice networks, domestic and international regulators, and industry. And it should be open to the widest possible membership, as a basis for policy exchange, dialogue and lesson-learning. Enforcement of standards, which is essential, is often a challenge for countries with limited resources; here, exchange of good practice can provide vital assistance. Lastly, the approach to standards should be part of a coordinated policy package for energy efficiency. International efforts should also incorporate issues such as support for building effective governance systems, delivering upfront finance for energy efficiency investments, and providing information to consumers.197
A programme of gradual convergence to global best standards in appliances, lighting, vehicles, buildings and industrial equipment could save 4.5-6.9 Gt CO2 in emissions by 2030, with significant financial savings and benefits to productivity. 198

A growing number of countries, sub-national governments and businesses are recognising the value of putting a price on carbon and phasing out fossil fuel subsidies. They are cooperating internationally to overcome barriers to these reforms and to accelerate progress.
A strong, predictable and rising carbon price – applied through a carbon tax or a cap-and-trade system – is a particularly efficient way to advance climate and fiscal goals. It sends important signals across the economy, helping to guide consumption choices and investments towards low-carbon and away from carbon-intensive activities. It can also raise fiscal revenues for productive uses. About 40 national and over 20 sub-national jurisdictions have now adopted or scheduled a price on carbon, covering an estimated 7 Gt CO2e, or about 12% of annual global greenhouse gas (GHG) emissions. This is triple the coverage a decade ago but is far short of what is required.
A growing number of countries, sub-national governments and businesses are recognising the value of putting a price on carbon and phasing out fossil fuel subsidies. They are cooperating internationally to overcome barriers to these reforms and to accelerate progress.
A strong, predictable and rising carbon price – applied through a carbon tax or a cap-and-trade system – is a particularly efficient way to advance climate and fiscal goals.199 It sends important signals across the economy, helping to guide consumption choices and investments towards low-carbon and away from carbon-intensive activities.200 It can also raise fiscal revenues for productive uses. About 40 national and over 20 sub-national jurisdictions have now adopted or scheduled a price on carbon, covering an estimated 7 Gt CO2e, or about 12% of annual global greenhouse gas (GHG) emissions.201 This is triple the coverage a decade ago but is far short of what is required.
In 2014 China launched two pilot regional emissions trading schemes (ETSs), bringing the total to seven; France and Mexico implemented carbon taxes; Chile approved a carbon tax, to start in 2018; and California and Quebec linked their cap-and-trade programmes. In January 2015, South Korea launched its ETS – one of the world’s largest – and Portugal enacted a carbon tax. In April, Ontario announced it will launch an ETS linked to the California and Quebec schemes. Next year, China plans to transition to a national carbon pricing system, and South Africa plans to introduce a carbon tax. The European Union is tightening its Emissions Trading System (EU ETS).202
Figure 8. Summary of existing, emerging and potential carbon pricing instruments (ETS and tax). Source: The World Bank, 2015203
After years of business opposition, many major companies, including in high-emitting sectors such as oil and gas, are now endorsing carbon pricing as well.204 They see it as a way to drive efficiency and profitable new business opportunities. More than 1,000 businesses and investors signalled their support for carbon pricing at the UN Climate Summit in September 2014, including BP, British Airways, Cemex, Braskem, Royal Dutch Shell, Statkraft, Unilever, Statoil and DONG Energy.205 In May, at the Business & Climate Summit 2015 in Paris, 25 global business networks representing more than 6.5 million companies called for “robust and effective carbon pricing mechanisms as a key component to gear investment and orient consumer behaviour towards low-carbon solutions and achieve global net emissions reduction at the least economic costs”.206 In addition, at least 150 companies in diverse sectors use an internal carbon price in assessing investments.207 Major oil companies such as Shell, BP, Exxon-Mobil and ConocoPhillips use a price of US$40 per tonne of CO2e or more.208
The growing support for carbon pricing reflects a recognition that it is not only good climate policy, but also a useful way to raise government revenue – one that is less distorting than many existing taxes such as on labour and business activities. The Canadian province of British Columbia has used its carbon tax revenue, around 3% of the total budget,209 to lower income and corporate taxes and compensate low-income households. Quebec and California use their permit auction revenues to fund low-carbon technology advancement. EU ETS auction revenues are used by Member States to fund innovation and climate- and energy-related activities, among other things.210
The evidence on carbon pricing suggests that it is effective at reducing emissions without harming the economy. In the US, for example, the nine states that participate in the Regional Greenhouse Gas Initiative (RGGI) have cut their emissions by 18% and their GDP has grown by 9.2% in 2009–2013. By comparison, emissions in the other 41 US states fell by only 4%, and their GDP grew by 8.8% over this same period.211 British Columbia’s carbon tax was increased from CD$5 in 2008 to CD$30 in 2012, and over this period helped to reduce per capita GHG emissions by about 10% (compared with a 1% reduction in the rest of Canada), without any adverse impact on GDP.212
Yet concerns that pricing carbon will hurt industrial competitiveness continue to restrain action. As a result, most explicit prices are still quite low, less than US$10 per tonne of CO2, and often without any mechanism or plan to increase them. Furthermore, a number of countries have provided exemptions or special treatment to their most polluting energy-intensive industries, thus limiting the effectiveness of the carbon price.
International cooperation can help to overcome this barrier. Instead of pushing for border carbon adjustments (BCAs) to try to “level the playing field” between countries of differing climate ambition, trading partners can coordinate the introduction of carbon prices of roughly comparable levels to overcome competitiveness concerns. By working together, countries can also benefit from knowledge-sharing on best practice, greater transparency, and the opportunity to link trading schemes.
Equally important is to phase out fossil fuel subsidies, which are effectively negative carbon prices. Subsidies to fossil fuel consumption in emerging and developing economies totalled US$548 billion in 2013,213 while fossil fuel exploration, production and consumption support in OECD countries amount to US$55–90 billion a year.214 Governments increasingly recognise that these subsidies are harmful to both the economy and the climate, and in the past two years alone, 28 have attempted reforms. The International Monetary Fund (IMF) has classified 12 of these as successes (leading to a permanent and sustained reduction of subsidies), 11 as partial successes, and five as unsuccessful.215 International cooperation can help create a level playing-field across trade partners or in a region. It can also help disseminate knowledge about what works best. For example, phasing in reforms over several years, as part of a broader fiscal reform package, and using in-kind transfers to more directly support poor and vulnerable households and to ease the impact of reforms.216
Conditions are now particularly favourable for both carbon pricing and fossil fuel consumption subsidy reform, due to the fall in global oil prices over the last year, combined with lower gas and coal prices.217 While these low prices may not last, in the short-term they can help to offset the energy price increases resulting from these measures, making it easier for consumers and businesses to adjust and reducing political resistance.218 It is notable that a number of countries, including Mexico, India and Indonesia, have seized the opportunity to advance reform of fossil fuel subsidies over the last year. Many of these reforms are expected to be permanent.
G20 countries have already agreed to phase out inefficient fossil fuel subsidies, and several are now acting with support of international institutions such as the IMF, the IEA, the OECD and the World Bank.219 The Asia-Pacific Economic Cooperation (APEC) economies have made a similar commitment. Now is the time to build on these commitments and introduce meaningful explicit carbon prices across countries at the same time.
Governments that choose to act have considerable support available. The Carbon Pricing Leadership Coalition, which brings together leaders from across government, the private sector and civil society, is working to increase knowledge on effective carbon pricing systems, and helping to define the business and economic case for carbon pricing.220 The World Bank Partnership for Market Readiness (PMR) has also helped to accelerate action, supporting countries in the preparation and implementation of carbon pricing instruments and other climate policies.221
If carbon pricing were widely adopted around the world, rising to an average of US$50 per tonne of CO2 in 2030 and including partial fossil fuel subsidy phase-out, the analysis conducted for this report estimates that global emissions could be reduced by 2.8-5.6 Gt CO2e. The economic benefits of these reductions, including the incentives for innovation and investment and efficiency from carbon prices, will drive a future of more sustainable and low-emissions growth.

Infrastructure is a foundation for economic growth. Robust, efficient power grids, water and sewer systems, transportation systems and communications networks are essential to modern economies and societies. They shape our economies in profound ways, determining whether people drive, walk, cycle or ride public transit, whether we remain dependent on fossil-fuelled power or move towards renewables, and whether heavy downpours cause devastating floods or landslides, or storm water is efficiently channelled out to sea.
Emerging and developing economies face high demand for new infrastructure to support growing populations, increased consumption and new industry, and many also have major maintenance backlogs on existing infrastructure systems. Even in developed economies, much infrastructure is outdated and sometimes decaying due to chronic underinvestment. As Better Growth, Better Climate shows, around US$90 trillion in infrastructure investment is needed by 2030 to achieve global growth expectations. That is equivalent to around US$6 trillion per year, but current annual global investment is estimated at only around US$1.7 trillion. About 60% of the investment needed is in emerging and developing countries.
Infrastructure is a foundation for economic growth. Robust, efficient power grids, water and sewer systems, transportation systems and communications networks are essential to modern economies and societies. They shape our economies in profound ways, determining whether people drive, walk, cycle or ride public transit, whether we remain dependent on fossil-fuelled power or move towards renewables, and whether heavy downpours cause devastating floods or landslides, or storm water is efficiently channelled out to sea.222
Emerging and developing economies face high demand for new infrastructure to support growing populations, increased consumption and new industry, and many also have major maintenance backlogs on existing infrastructure systems. Even in developed economies, much infrastructure is outdated and sometimes decaying due to chronic underinvestment.223 As Better Growth, Better Climate shows, around US$90 trillion in infrastructure investment is needed by 2030 to achieve global growth expectations.224 That is equivalent to around US$6 trillion per year, but current annual global investment is estimated at only around US$1.7 trillion. About 60% of the investment needed is in emerging and developing countries.
Most infrastructure assets last for 30–50 years or longer, so the choices made in the next 15 years, particularly about energy, transport and urban design, will shape the trajectory of economies for many decades. The challenge is thus twofold: to mobilise sufficient finance, and to ensure that infrastructure investments are chosen well to provide a foundation for sustained growth, prosperity and resilience. Getting these investments wrong will waste resources on assets which may not stand up to future climate change impacts, and exacerbate risks if they directly or indirectly lock in high emissions for decades. High-carbon investments may also increase dependence on price-volatile fossil fuels – and risk being devalued or stranded under future climate policies.
As shown in Figure 9, global aggregate infrastructure investment requirements to 2030 are projected to be around US$89 trillion. Shifting to low-carbon infrastructure would add about US$4 trillion in investments, an increase of less than 5%. The reason for the small increase is that the higher capital costs of investment in energy efficiency and low-carbon energy would be largely offset by capital savings from lower investment in fossil fuels, electricity transmission and distribution, and from a shift to better-planned and more compact cities. The additional upfront investment costs will of course need to be financed. But over their lifetimes, they could yield substantial savings – particularly from avoided fuel use – and other benefits that would largely offset any additional upfront capital investments. The case for ensuring that new infrastructure and upgrades alike are “climate-smart” – both climate-resilient and low-carbon – is thus very strong.
In recent years infrastructure investment has become a core focus of international economic cooperation, notably through the G20 and the development finance institutions (DFIs). The G20 established in 2014 a new Global Infrastructure Initiative, along with an implementing “Infrastructure Hub”, with the aim of catalysing both public and private investment.225 The World Bank now hosts the Global Infrastructure Facility (GIF), a platform to facilitate the development of public-private partnerships (PPPs) to mobilise private-sector and investor capital for infrastructure projects.226 The African Development Bank (AfDB) has established the Africa50 Infrastructure Fund, aiming to accelerate infrastructure development, and plans to raise US$3 billion in equity capital to begin operations.227 New multilateral and national development banks are being established with a specific infrastructure focus, notably the Asian Infrastructure Investment Bank (AIIB)228 and the New Development Bank.229
Yet the G20 Global Infrastructure Initiative largely ignores the close links between infrastructure investment and climate change, as do many national and local government planning processes: too often infrastructure and climate policies exist in separate silos. This creates potentially costly inconsistencies, sends mixed signals to investors, and heightens the risk of short-sighted infrastructure decisions.
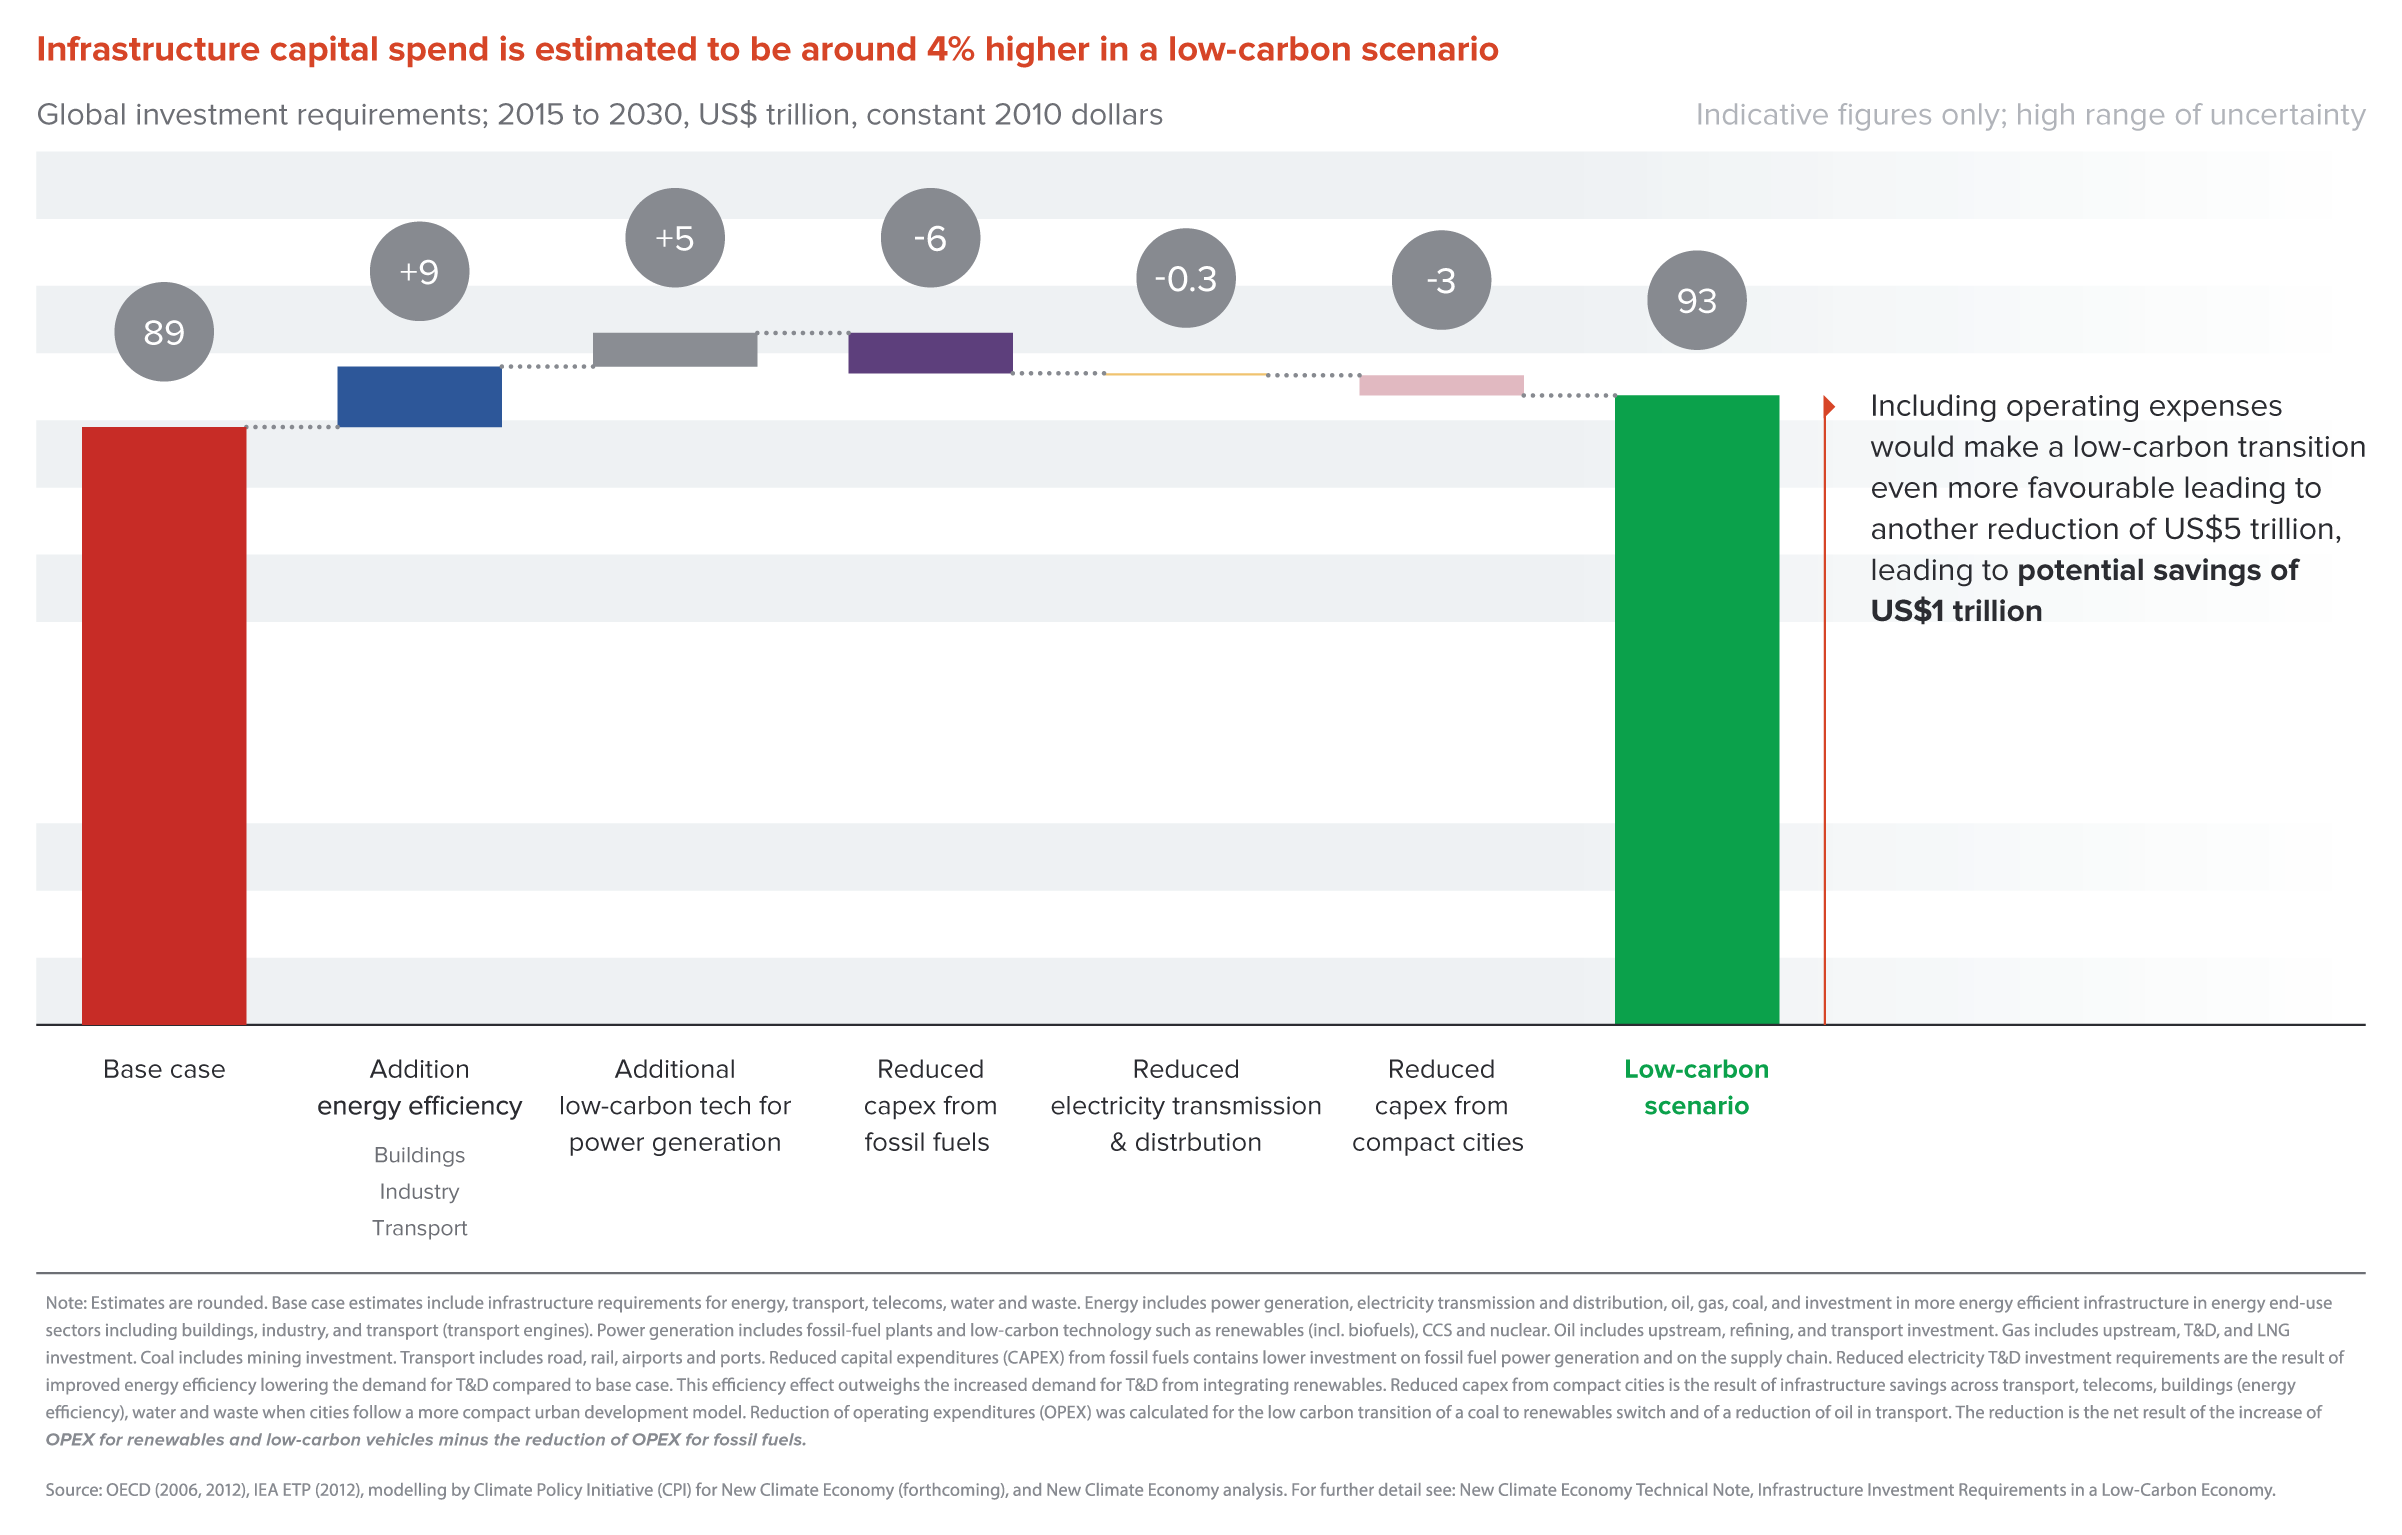
Figure 9. Global investment requirements 2015-2030, US$ trillion, constant 2010 dollars. Source: Global Commission for the Economy and Climate, 2014.230
The importance of sustainable infrastructure for growth in developing countries makes it a priority for international financing, particularly by national and international DFIs. They can help to tackle market failures in the provision of private finance, for example by providing guarantees and other instruments to reduce policy or technical risks, by providing technical assistance and sharing best practices. As indicated in Section 2.3, there is a strong case for expanding the balance sheets and increasing the capital commitments of the multilateral development banks (MDBs), enhancing their capacity to mitigate risk and leverage greater private finance.231
International cooperation can also help mainstream climate into infrastructure investment, particularly through the DFIs. For example, several DFIs, including the World Bank, the European Investment Bank (EIB) and the European Bank for Reconstruction and Development (EBRD), as well as a number of bilateral finance institutions, are committing to halting unabated coal project financing. The MDBs have worked together for some years on how to shift their own investments and leverage other finance for climate-smart infrastructure, and continue to draw out lessons of good practice, but this effort will need to extend to national development banks and the newer MDBs. Making best practices the norm, across all DFIs old and new, national and multilateral, will help ensure that all capital is deployed toward low-carbon investments.
Progress is already being made: for example, the MDBs and the International Development Finance Club (IDFC), a network of national and sub-regional development banks, have agreed to work together to track and develop best practices for greening finance.232 Fully mainstreaming climate issues into infrastructure investments around the world will require rethinking policy and planning processes, overall and for individual projects. Approaches will need to be tailored to each country and financial institution, but should follow two high-level principles:
In particular, it would be sensible for the G20 to adopt these principles as part of its Global Infrastructure Initiative and its other related programmes, such as its Voluntary High-level Principles of Long-Term Investment Financing by Institutional Investors and in the work of the G20 Climate Finance Study Group.233 They would also be appropriate for adoption by DFIs, national development banks and sovereign wealth funds. And they could usefully steer the decisions of private investors, particularly those considering medium and long-term structural risk to project assets and portfolios, and those seeking ways to enhance long-term value creation.234
Integration of climate-smart principles into infrastructure decision-making needs to happen at three levels: in the design and alignment of overall strategy and policy, in the composition and balance of infrastructure plans and portfolios considered as a whole, and in relation to individual projects. Alignment of government policy is particularly crucial, as inconsistency between government policies inhibits investment and raises the cost of capital.235 Once the overall strategic direction is set, a range of methods and instruments are available to mainstream climate at the project level.236 This needs to happen at the technical assessment stage, where technological and process options and alternatives are considered that will achieve the project aim; at the economic assessment stage, which involves measuring net impacts of the project on welfare; and at the financial assessment stage, where costs and revenues of the project are assessed.237

Innovation is a fundamental engine of long-term productivity and growth, and is critical for delivering low-carbon growth in particular. As Better Growth, Better Climate highlights, advances in digitisation, materials science and biotechnology, along with new business models, have the potential to transform markets and dramatically cut resource consumption. For example, it is estimated that “circular economy” models, which minimise resource and energy use and maximise recycling, could add up to US$1 trillion to the global economy by 2025. But while existing technologies, widely applied, could achieve medium-term climate goals, more innovation is needed to support the transition to a 2°C pathway. International cooperation can help accelerate progress and spread the benefits of innovation around the world – particularly to emerging and developing economies.
Important collaborations are already under way. In November 2014, the US-China Clean Energy Research Center was expanded to cover joint research on clean vehicles, building energy efficiency and clean coal. The Low Carbon Technology Partnerships Initiative, a collaborative platform to accelerate diffusion of existing technologies and develop public–private partnerships (PPPs), was launched in May 2015. And since 1995, the International Energy Agency has increased the number of non-IEA members in its energy technology initiatives sevenfold. In agriculture, the Consultative Group for International Agriculture Research (CGIAR) is channelling about US$1 billion per year into RD&D to develop more productive and resilient crop varieties and to test improved agricultural techniques particularly suited to developing countries.[1] Still, there is scope to do much more.
Innovation is a fundamental engine of long-term productivity and growth,238 and is critical for delivering low-carbon growth in particular. As Better Growth, Better Climate highlights, advances in digitisation, materials science and biotechnology, along with new business models, have the potential to transform markets and dramatically cut resource consumption.239 For example, it is estimated that “circular economy” models, which minimise resource and energy use and maximise recycling, could add up to US$1 trillion to the global economy by 2025.240 But while existing technologies, widely applied, could achieve medium-term climate goals, more innovation is needed to support the transition to a 2°C pathway. International cooperation can help accelerate progress and spread the benefits of innovation around the world – particularly to emerging and developing economies.
Important collaborations are already under way. In November 2014, the US-China Clean Energy Research Center was expanded to cover joint research on clean vehicles, building energy efficiency and clean coal.241 The Low Carbon Technology Partnerships Initiative, a collaborative platform to accelerate diffusion of existing technologies and develop public–private partnerships (PPPs), was launched in May 2015.242 And since 1995, the International Energy Agency has increased the number of non-IEA members in its energy technology initiatives sevenfold.243 In agriculture, the Consultative Group for International Agriculture Research (CGIAR) is channelling about US$1 billion per year into RD&D to develop more productive and resilient crop varieties and to test improved agricultural techniques particularly suited to developing countries.244 Still, there is scope to do much more.
Innovation occurs through a complex ecosystem of actors, institutions, interconnecting networks and economic and social contexts, and at various stages in the life-cycle of technologies, from basic research to mass deployment. Within this system, investment in research, development and demonstration (RD&D) is particularly important for the development of new technologies and processes. Public spending support for research has long been recognised as economically justified, since it generates knowledge spillovers and benefits to society as a whole. But current levels of RD&D investment in energy and agriculture – the main sources of GHG emissions – are very low.
Public funding for energy-related RD&D in IEA member countries was US$18.2 billion in 2013 – three-quarters of it for low-carbon technologies. This is more than 20% higher, in absolute terms, than in 2008,245 but as a share of GDP, energy-related RD&D is less than half what it was in the early 1980s.246 Private investment is similarly low.247 Global public funding for agriculture RD&D was US$32 billion in 2008, and its share of overall public RD&D expenditure was only 3% in advanced economies.248 It is in this context that Better Growth, Better Climate calls for major economies to triple public energy-related RD&D spending, with the aim of exceeding 0.1% of GDP, and for a doubling of R&D in agriculture and agroforestry.249
Most innovation activity has historically been in advanced economies, which registered about 80% of climate-related patents in 2000–2011.250 In 2013, they still accounted for about 74% of total RD&D in renewable energy.[xiv] Activity in emerging economies is growing, however, particularly in China, which accounted for about 21% of global renewable energy R&D spending in 2013.[xv] India, Brazil, and to a lesser extent, Russia, Mexico and South Africa are also making substantial RD&D investments, mostly through state-owned enterprises.
Not all countries need to be at the frontier of RD&D, but at the very least, they need to be able to adopt and adapt innovations developed elsewhere. However, innovation ecosystems vary widely across countries, with generally lower absorptive capacity in low- and middle-income countries.251 This poses significant challenges for development, particularly for countries wishing to pursue low-carbon pathways. There is huge potential to “leapfrog” to new, clean technologies, but it requires sustained effort over many years to develop the innovation skills, institutions and knowledge networks to support innovation activities and technology uptake.252
Investing in climate-related innovation would be particularly beneficial for emerging and developing economies, where emissions are growing most rapidly and climate vulnerability is particularly stark. Rather than belatedly adopting technologies developed elsewhere, often at significant expense, countries can seize the opportunity to develop their own, locally-adapted solutions, which can in turn help drive industrial production and economic growth, as well as cutting emissions and improving resilience. These solutions could also become valuable exports, and be shared with other developing countries as a form of South-South cooperation.
Public funding for RD&D is particularly needed in technologies which will be required to reduce emissions after 2030. The IEA describes the current status of all such low-carbon technologies as “off track”.253 A number of areas are in particular need of stronger RD&D effort:
International cooperation can enable countries to share costs and risks, link RD&D activities to early market formation, increase knowledge-sharing, combine global capabilities, and build capacity. International efforts may involve national innovation programmes directly supporting RD&D activity by overseas entities; direct bilateral collaboration (such as IEA Implementing Agreements); and intergovernmental or non-governmental programmes supporting international activity (such as the Climate Innovation Centres259). International cooperative efforts on public RD&D should aim to enhance and complement, rather than distort or displace, domestic public RD&D programmes and existing private sector efforts.
The role of the private sector is vital. It is private companies – mostly multinationals and early-stage investors – that currently drive most international cooperation. Overall data on RD&D shows that spending by multinational innovator companies outside their home countries260 accounts for at least 10–20% of private-sector RD&D activity. In the case of smaller high-innovation countries, over 60% of their private-sector RD&D might come from foreign enterprises.261 This includes, among other things, setting up global networks of innovation centres, joint innovation projects or ventures between multiple firms in different countries, foreign investment by venture capital, and combinations of all of the above.
The private sector tends not to invest in lower-income countries, however. International innovation activities tend to be heavily concentrated in countries with mature innovation ecosystems and large short- to medium-term market potential. For example, around 90% of US companies’ overseas innovation activity is in Europe, Japan, Canada, China, Brazil and India.262 Cooperative mechanisms such as voluntary patent pooling, open-source innovation and open licensing agreements are therefore needed to enable the rapid diffusion of key low-carbon solutions, while still providing the private sector with incentives to innovate.263
Experience to date suggests a number of principles that should be incorporated into the design of new or existing international co-operative efforts on RD&D. Lessons from national RD&D efforts and initiatives such as CGIAR suggest that it is important to achieve sufficient scale to ensure the basic foundations of a robust innovation ecosystem. This includes priority-setting processes, systems for quality assurance and evaluation, and mechanisms for intellectual property management. Long-term commitments that build trusting, effective relationships are particularly important; the IEA energy technology initiatives suggest that decade-long initial commitments may be needed. And strong public-private partnerships are crucial. Technology “challenges”, where different technological solutions are sought to a general problem, may also be useful: an “Apollo” project for clean energy has recently been established, and there is clear potential for similar programmes in other key fields.264

Major businesses generate a large share of global greenhouse gas emissions: nearly 15% come from the largest 500 companies alone. Yet businesses also drive technological innovation and low-carbon economic activity. And while major companies and business associations previously often opposed climate policy – some still do – many now demand it. Most recently, at the Business and Climate Summit in Paris in May, business associations whose networks represent 6.5 million firms called for strong climate action and a new international climate agreement.
Companies are increasingly integrating climate change into their business and investment strategies. Tackling climate change is a huge business opportunity: the global market for low-carbon and environmental goods and services was estimated at US$5.5 trillion in 2011–12, and is growing at over 3% per year. Businesses are developing new products and services to seize this opportunity; identifying and addressing climate risks in their operations and supply chains; and reducing their GHG emissions. This is starting to happen across a variety of sectors, including energy-intensive ones such as cement, chemicals, and iron and steel, where emissions are large and significant reduction poses undeniable challenges.
Major businesses generate a large share of global greenhouse gas emissions: nearly 15% come from the largest 500 companies alone.265 Yet businesses also drive technological innovation and low-carbon economic activity. And while major companies and business associations previously often opposed climate policy – some still do – many now demand it. Most recently, at the Business and Climate Summit in Paris in May, business associations whose networks represent 6.5 million firms called for strong climate action and a new international climate agreement.266
Companies are increasingly integrating climate change into their business and investment strategies. Tackling climate change is a huge business opportunity: the global market for low-carbon and environmental goods and services was estimated at US$5.5 trillion in 2011–12, and is growing at over 3% per year.267 Businesses are developing new products and services to seize this opportunity; identifying and addressing climate risks in their operations and supply chains; and reducing their GHG emissions. This is starting to happen across a variety of sectors, including energy-intensive ones such as cement, chemicals, and iron and steel, where emissions are large and significant reduction poses undeniable challenges.268
The corporate reporting initiative CDP269 estimates that in 2014, almost 1,400 companies reporting to it (59% of the sample) achieved an aggregate of 700 Mt CO2e of emissions reductions through implementation of more than 90,000 projects.270 This is roughly equivalent to the 2012 emissions of France and the Netherlands combined.271 In the past such actions were generally motivated by the requirements of policy, corporate social responsibility, or the anticipation of future policies. But increasingly they are driven by a clear business case.
Companies typically reduce their emissions by improving energy efficiency and adopting lower-carbon technologies, processes and operating methods. Such actions can unlock significant savings in energy, resource and fuel costs, and also boost productivity and innovation. Among the Fortune 100, 53 companies reported saving a combined US$1.1 billion in 2013 from energy efficiency, renewable energy and other emission reduction initiatives – an average of over US$10 million per company.272 In an analysis for the We Mean Business coalition, CDP found that in 2013, the global average internal rate of return (IRR) on low-carbon projects by companies reporting to them was 11%, though there was significant variation by country and investment type, with some much higher.
273 Indeed, there is growing evidence that emissions reduction does not undermine profitability, and may even enhance it.274 The CDP Climate Leadership Index (made up of companies taking the strongest climate action) has outperformed the Bloomberg World Index of top companies by 9.1% over the past four years (see Figure 10).275
Figure 10: Companies taking ambitious climate action are outperforming the market. Source: Adapted from CDP, 2014.276
Shareholders, customers and other stakeholders are also pushing businesses to take climate action. A global survey in 2013 found more than 80% of asset owners and nearly 70% of asset managers viewed climate change as a material asset risk.277 Of the 2,345 companies reporting to CDP in 2014, 88% considered climate change a risk to their operations.278 In April and May 2015, shareholders of Shell and BP passed resolutions requiring the companies to report the actions they were taking in relation to climate change, including emissions management, asset resilience, research and development in low-carbon technologies, and support for public policy.279
Yet there is much greater potential.280 A large share of major businesses around the world have yet to adopt emissions reduction targets and plans,281 and many of those that have are relatively limited in their ambition. Only a very small number of companies have set long-term (2030 or later) targets which can be considered to be in line with a sectoral 2°C pathway.282 An analysis of 70 of the world’s largest publicly listed corporate emitters, across the aluminium, cement, chemicals and electric utilities sectors, found that 21 had targets up to 2020 which could be considered consistent with a 2°C sectoral pathway, but only 7 had targets to 2030 or later.283 Twenty others had non-2°C or “irrelevant” targets, and the rest had none at all. It is clear that efforts need to be extended and ambitions raised if businesses are to achieve a low-carbon transformation.
Most climate actions by businesses to date have been undertaken by individual companies acting alone. But in recent years, several business-led cooperative initiatives have emerged to set new norms and expectations for how businesses should respond to climate issues.
Some initiatives focus on establishing targets, or common commitments or standards. The GHG Protocol, for example, provides common international standards for business emissions reporting.284 The Science Based Targets initiative goes further, encouraging companies to set medium- and long-term emissions reduction targets consistent with a global 2°C trajectory. The initiative provides a rigorous methodology based on sectoral shares of total emissions, in order to give these targets independent credibility.285 Similarly, signatories to the RE100 initiative agree to source their electricity from 100% renewable sources, with a clear time frame for reaching their goal.286
In the finance sector, a growing number of initiatives aim to set standards for responsible behaviour. The Principles for Responsible Investment (PRI) includes around 1,400 asset owners, investment managers and service providers representing more than half the world’s institutional investment capital. PRI members report having engaged more than 1,660 companies in around 60 countries, seeking improvement in environmental, social and governance (ESG) policies and practices, including carbon emissions disclosure, targets and corporate lobbying on climate policies.
The market for investments including some form of ESG now represents around a third of all assets under management, and evidence and practice suggest that consideration of ESG factors can reduce risk and improve investment and business performance.287 Under the Montreal Pledge, meanwhile, asset owners and investment managers commit to measuring and disclosing the carbon footprint of their assets. The aim is to have at least US$3 trillion of assets covered by the pledge by the end of 2015.288 More radically, the Portfolio Decarbonisation Coalition encourages asset holders to decarbonise their investment portfolios.289
But individual business action is rarely sufficient to transform whole markets and sectors in a low-carbon direction. For this a critical mass of companies is needed to build economies of scale, shift demand, and advocate for consistent regulatory policies. A number of initiatives have emerged over recent years seeking to catalyse the low-carbon transformation of specific sectors, value chains, technologies or products in this way.
The Low Carbon Technology Partnerships initiative (LCTPi), for example, has brought together about 100 companies to accelerate the development and deployment of low-carbon technologies in key fields. Some LCTPi action plans are focused on energy-intensive sectors, such as the Cement Sustainability Initiative, and in chemicals; others focus on technologies such as carbon capture and storage and advanced biofuels. The LCTPi involves dialogue with governments on removing policy barriers and the formation of public-private partnerships for research, demonstration and development.290
Similarly, the Tropical Forest Alliance 2020 (TFA 2020) aims to transform markets for key agricultural commodities, with producers, traders and consuming companies all committing to eliminate deforestation from their supply chains. The aim is to extend current commitments for palm oil to other commodities such as soy, beef, and pulp and paper.291 Under the Soft Commodities Compact of the Banking Environment Initiative, major banks representing 20% of the international financing of agricultural commodities are developing new financing solutions for sustainably sourced commodities.292
There is significant scope for such initiatives to be developed in other sectors, particularly among energy-intensive industries and the oil and gas sector.293
Wider attempts to transform the financial sector are also under way. The United Nations Environment Programme (UNEP) Inquiry into a Sustainable Financial System is working with central banks and financial regulators to examine how the financial system as a whole can help support the low-carbon transition. It argues for an expansion of the scope of risk management to include climate factors, and mechanisms to facilitate the flow of capital into low-carbon investment. Through the Focusing Capital on the Long Term initiative, a group of major investors is proposing ways to reorient investment practices away from “short-termism”, through changes in asset manager contracts, benchmarking, evaluation and incentives and clear statements of investment beliefs.294 The Climate Bonds Initiative aims to drive the expansion of new financial instruments for low-carbon investments.295
These initiatives have been accompanied by a rise in business-led climate advocacy. New coalitions are calling for clear, long-term and stable low-carbon policy signals to guide investment and innovation. Formed in 2014, We Mean Business brings together seven global associations to amplify the business voice.296 At the UN Climate Summit last September, the Global Investor Coalition brought together 350 investors with combined assets of US$24 trillion to call for stronger climate policy.297 Business advocacy could also play a crucial role, together with trade unions and community organisations, in working to ensure a just and efficient transition to a low-carbon economy, by helping affected workers and communities, for example in coal mining and energy-intensive sectors, to shift into new sectors of employment.
It is too soon to know how successful these initiatives will be. But they offer the potential to shift the huge resources of business investment and innovation towards driving a low-carbon transition. More broadly, there is a need to engage businesses all around the world, not just in developed countries. The prize is to align business interests more closely with the requirements of a 2°C pathway, to drive deeper emissions reductions and expand low-carbon markets.

Global aviation and maritime shipping combined produce about 5% of global CO2 emissions, and by 2050 their share is projected to rise to 10–32%. While domestic aviation and shipping are covered under national policies and emission inventories, emissions from international aviation and shipping, which make up a majority of emissions in each sector, are not. They need to be addressed through internationally coordinated policies, in order to ensure efficiency in these global markets and minimise potential competitiveness impacts.
The UN governing bodies of these sectors, the International Maritime Organization (IMO) and the International Civil Aviation Organization (ICAO), have both made efforts to adopt policies for reducing international emissions, for which they are responsible, since they were directed to do so 17 years ago through the Kyoto Protocol. But progress has been very slow. In 2013, the IMO set design efficiency standards for new ships, and ICAO is due to decide in 2016 on the implementation of a market-based measure to control emissions from 2020.
Global aviation and maritime shipping combined produce about 5% of global CO2 emissions, and by 2050 their share is projected to rise to 10–32%.298 While domestic aviation and shipping are covered under national policies and emission inventories, emissions from international aviation and shipping, which make up a majority of emissions in each sector, are not.299They need to be addressed through internationally coordinated policies, in order to ensure efficiency in these global markets and minimise potential competitiveness impacts.
The UN governing bodies of these sectors, the International Maritime Organization (IMO) and the International Civil Aviation Organization (ICAO), have both made efforts to adopt policies for reducing international emissions, for which they are responsible, since they were directed to do so 17 years ago through the Kyoto Protocol. But progress has been very slow. In 2013, the IMO set design efficiency standards for new ships, and ICAO is due to decide in 2016 on the implementation of a market-based measure to control emissions from 2020.
Several cost-effective options are available for further reducing emissions from aviation and shipping, mainly from more efficient fuel usage. New aircraft technology and harmonised air traffic management systems also offer opportunities to continue lowering fuel costs in aviation. In shipping, it is estimated that taking full advantage of already available efficiency measures could save over US$30 billion in fuel costs each year for the industry and avoid 300 Mt CO2 per year by 2030.300
Aviation is a major economic sector, central to trade and to growth for both developing and developed countries. Aircraft carry about 35% of world trade by value, although only 0.5% by volume.301 The airline industry is growing rapidly: revenue has doubled in the past decade, from US$379 billion in 2004, to US$733 billion in 2014,302 and passenger bookings are forecast to double to over 6.5 billion by 2032.303
Aviation is also a major contributor to global greenhouse gas (GHG) emissions, accounting for 13% of fossil fuel use in transport and about 2% of global CO2 emissions.304 International aviation consumed 142 Mt of fuel in 2010, producing about 448 Mt of CO2 emissions, up from 185 Mt CO2 in 1990.305 Given the growing role of aviation in the global economy, trade and business, ICAO expects international aviation emissions to rise to 682–755 Mt CO2 by 2020.306 Further, aviation’s non-CO2 emissions at high altitudes exacerbate the impact on warming to 2-4 times greater than that of CO2 alone.307
Controlling aviation emissions growth will not be easy, but it is crucial given the size of the sector’s emissions. On the demand side, there is a need to provide viable alternatives to flying – such as high-speed rail and wider use of communications technologies that reduce travel needs. Within the sector, the focus needs to be on improving fuel efficiency and shifting to cleaner fuels.
Both domestic policy and ICAO-led international policy have a role to play in incentivising such changes. At the domestic level, several countries including Japan, Brazil and others have implemented jet fuel taxes for domestic flights, and Norway has levied a carbon tax on domestic aviation since 1991.308 In June 2015, the US Environmental Protection Agency took initial steps toward regulating aviation emissions.309 Emissions from flights within the EU are covered by the EU Emissions Trading System (ETS),310 but longstanding legal agreements, including the 1944 Convention on International Civil Aviation and numerous bilateral agreements, have effectively prevented taxation of fuel for international aviation.311
Fuel is a major cost for the industry: US$208 billion in 2013, or 30% of total costs,312 so fuel efficiency measures are economically attractive. And there is considerable room for improvement: there was a 27% difference in the fuel efficiency of the least and most fuel-efficient US airlines in 2013.313
Fuel efficiency can be improved through improved infrastructure, operational measures such as reducing the weight of on-board equipment, and improved aircraft design and materials. “Winglets”, for instance – up-tilted wingtip devices that reduce aircraft drag – can cost over US$1 million per aircraft to install, but improve fuel efficiency by 4% and pay for themselves in about two to three years (depending on fuel cost).314 Beyond these types of improvements, however, further emissions reductions from aviation may be quite costly and options are limited. Some carriers are also testing specialised biofuels; as in other sectors, however, there are questions about biofuels’ life-cycle emissions, sustainability and cost-effectiveness.
Policy action is needed to accelerate progress. While regulation through the EU or domestic policy is an option, acting through ICAO would ensure a harmonised approach across the sector globally, increasing coverage and reducing administrative burden. Yet ICAO has moved slowly since the 1997 Kyoto Protocol suggested it take action, drawing considerable criticism.315 At the 37th ICAO Assembly in 2010, governments set aspirational goals to improve fuel efficiency by 2% per year and make international aviation’s growth from 2020 onwards “carbon-neutral”, but these commitments are not binding and are unlikely to amount to the reductions needed for a 2°C pathway.316
Through ICAO, governments, civil society and the industry are also developing a global CO2 standard for new aircraft to be agreed in 2016.317 The coverage of this standard has not yet been finalised. If only “new types” of aircraft are included under the standard, then just 5% of the global fleet would be covered by 2030. If all “new in-production” aircraft are included, fleet coverage would rise to 55% in 2030.318 
Figure 11. CO2 emission trends from international aviation. Source: ICAO, 2013.319
These efforts are unlikely to be sufficient to meet the industry’s targets, however, so ICAO has also taken steps to establish a market-based measure (MBM) to “bridge the gap” (see Figure 11). ICAO is due to take a decision on the measure in 2016, which would be fully implemented in 2020.320 Three options are currently being considered: an offset scheme in which carriers purchase permits or offsets to cover CO2 emissions above an agreed level; an offset scheme with revenue, applying a fee per unit traded and using the funds to assist developing countries with implementation, for example; or a global emissions trading scheme, which would cap total emissions from the sector, issue allowances for this amount, and distribute or sell them at auction to carriers.321 A simple offset scheme is favoured by some industry groups, and most discussions in ICAO are focused on it; but all three options remain on the table, and the potential to generate revenue makes the option two options particularly attractive.322
An ICAO study found that an MBM to cap net emissions at 2020 levels could require offsetting 464 Mt CO2 in 2036, roughly half of projected emissions. ICAO has estimated that if carbon prices rose from US$30 in 2020 to US$45 in 2035, an MBM would only slow international aviation growth slightly, to 107% in 2020–2036, against a baseline of 110%.323 The additional cost to airlines would be US$10/seat for a long-haul flight of 10,000–12,000 kilometres, and US$1.50/seat for a short-haul flight of 900–1,900 km, with most models suggesting that almost all the cost would be passed on to consumers.324 Global industry profits in the year 2036 would be US$33.3 billion, US$0.4 billion lower than in a baseline scenario.325
A key issue in the design of any MBM is its distributional impact – particularly how it will affect developing countries. ICAO decided in 2012 that any MBM should accommodate “the special circumstances and respective capabilities of developing countries”.326 One way of achieving this would be to provide financial support to affected low-income countries, or to only buy offsets from developing countries. Some have also suggested exempting some routes or countries.
International shipping carries about 90% of world trade by volume, on a fleet of more than 50,000 ships.327 Demand for maritime transport has risen significantly: total cargo on international seaborne trade grew from 2.6 billion tonnes in 1970 to 9.5 billion tonnes in 2013.328GHG emissions from shipping have also increased sharply, to 949 Mt CO2 in 2012, or 2.7% of global CO2 emissions, up from 1.8% in 1996.329 By 2050, the IMO projects that CO2 emissions from shipping will rise by 50–250%.330
Because of the global nature of shipping, international action is essential for effective regulation. A ship can be owned by a company based in one country, registered in another, and operated out of a third.331 Because shipping companies operate in so many different countries, the transaction cost of having different policies in different states would also be prohibitively high. However, IMO has made little progress thus far.
Virtually all GHG emissions from shipping arise from the fuels used in ship engines.332 Shipping consumes 250–325 Mt of fuel per year,333about 85% of which is heavy fuel oil (HFO).334 Shipping is generally more efficient in terms of emissions than other forms of transport, but ship efficiency varies widely based on design, fuel and power sources, and operations.335 Even ships with similar designs can operate with vastly different efficiencies336 – the most efficient crude oil tanker is about one-fifth as fuel-intensive as the least efficient.337
Key drivers of operational efficiency are speed (a 10% slower speed reduces fuel use per hour by 27%338) and utilisation rate – fully loaded ships are most efficient. Reliable data on operational efficiency are scarce, however, which remains a significant challenge. Design efficiency, meanwhile, depends on ship size, shape, capacity, power and other technical features.339 It has declined by about 10% in new ships since 1990, in part because high freight rates encouraged more block-like, less hydrodynamic designs, but began improving again in 2008.340
Fuel represents 50% or more of a ship’s operating cost, and there are several cost-effective ways to increase fuel-efficiency.341 For example, polishing propellers more often can increase efficiency by 4%, and costs just US$13 per tonne of fuel saved (at US$300–800 per tonne).342 One company has found that a fouling-resistant hull coating applied to a bulk cargo vessel at a cost of US$360,000 saved about 5,400 tonnes of fuel over nine years, a 22% efficiency improvement.343 At a fuel cost of US$300 per tonne, the technology would fully pay itself back in just over two years, and over US$1.2 million would be accrued in net savings over nine years.
Two systemic market failures have kept the industry from embracing and rewarding energy efficiency measures.344 First, there is little reliable information on ship efficiency and the expected gains from different technologies and operational measures. Second, incentives are split between the ship owner and charterer. Though individual contracts vary, ship charterers often bear some or all of the fuel costs, while the owner is responsible for the ship’s technology and design. Fully embracing available efficiency measures could significantly reduce the sector’s emissions, as illustrated in Figure 12 below.
Figure 12. If the entire fleet achieved the efficiency of 2011’s industry leaders by 2035, shipping’s total emissions could decrease while shipping activity doubles. Source: ICCT, 2013
Several independent initiatives have emerged to address the lack of transparency around fuel efficiency of ships in the industry, to enable charterers to inform their choice of carriers with information on expected fuel costs. For example, the organisations RightShip and Carbon War Room provide a public rating system of over 70,000 vessels that grades each ship on design efficiency.345 The Clean Shipping Index provides a similar service, rating carriers on all pollutants, including NOX, SOX, particulate matter, chemicals, and on-board waste.346 However, these voluntary initiatives do not yet have full industry-wide influence, and they lack a single, standardised methodology for evaluating efficiency.
Tailored financing schemes to support energy efficiency investments have also emerged, including the Sustainable Shipping Initiative’s Save As You Sail (SAYS) and the Self-Financing Fuel-Saving Mechanism (SFFSM) driven by Carbon War Room and University College London.347 In both models, a third-party financier pays for the upgrades, and the cost savings are shared between the third party, owner, and charterer (depending on who is paying for the fuel).
The IMO has declared that shipping “will make its fair and proportionate contribution” towards achieving global climate change mitigation goals.348 It has adopted two key approaches: the Energy Efficiency Design Index (EEDI), which requires new ships built from January 2013 to meet an efficiency standard that will be raised over time,349 and the Ship Energy Efficiency Management Plan (SEEMP), a tool that ships are required to use to identify energy-saving measures (though they are not required to adopt them).350 The EEDI and SEEMP are expected to save an average of US$200 billion in fuel costs and 330 Mt CO2 annually by 2030 at marginal cost in the near term.351
Still, these policies are not enough to stem the rapid growth in shipping emissions due to increased transport demand.352 Several additional policy proposals were submitted to the IMO in 2010, including an emissions offset scheme, a fuel tax, and mandated energy efficiency targets, but they have not been taken up. In May 2015 the Republic of the Marshall Islands – the third-largest flag registry in the world – submitted a proposal to the IMO’s Marine Environmental Protection Committee (MEPC) for the adoption of a global emission reduction target.353 However, the Committee decided to focus instead on finalising the emissions data collection system.
Given the constraints that have hindered take-up of cost-effective efficiency measures to date, there are strong grounds for the IMO to adopt operational efficiency requirements that apply to all ships. These could be complemented by a trading scheme that would permit highly efficient ships to sell their extra “efficiency credits” to less efficient ships. These requirements would need to be ramped up over time to motivate continual improvement and adoption of cutting-edge technologies.

Hydrofluorocarbons (HFCs) are the fastest-growing group of greenhouse gases in much of the world, with emissions of major HFCs rising by 10–15% per year. Developed to replace chemicals being phased out under the Montreal Protocol on Substances that Deplete the Ozone Layer, they are used as refrigerants in air conditioners and other products, to make insulating foams, and as solvents. They do not harm the ozone layer, but are potent greenhouse gases, with particularly large near-term climate impacts.
Developed countries already include HFCs in national emissions inventories under the United Nations Framework Convention on Climate Change (UNFCCC). But to catalyse rapid action and mobilise finance, more than 100 countries now support amending the Montreal Protocol to phase down the production and use of HFCs with the highest climate impact. Such a phase-down could avoid 1.1–1.7 Gt CO2e of HFC emissions per year by 2030, while driving significant energy efficiency improvements with both economic benefits through energy savings and climate benefits. The Montreal Protocol includes a Multilateral Fund which could help finance HFC phase-down in developing countries.
Hydrofluorocarbons (HFCs) are the fastest-growing group of greenhouse gases in much of the world, with emissions of major HFCs rising by 10–15% per year. Overall, HFC emissions are growing at a rate of 8–9% per year, but the focus of mitigation efforts is on widely used HFCs with high global warming potential (GWP), where emissions are growing faster.354 Developed to replace chemicals being phased out under the Montreal Protocol on Substances that Deplete the Ozone Layer, they are used as refrigerants in air conditioners and other products, to make insulating foams, and as solvents. They do not harm the ozone layer, but are potent greenhouse gases, with particularly large near-term climate impacts.355
Developed countries already include HFCs in national emissions inventories under the United Nations Framework Convention on Climate Change (UNFCCC). But to catalyse rapid action and mobilise finance, more than 100 countries now support amending the Montreal Protocol to phase down the production and use of HFCs with the highest climate impact. Such a phase-down could avoid 1.1–1.7 Gt CO2e of HFC emissions per year by 2030,356 while driving significant energy efficiency improvements with both economic benefits through energy savings and climate benefits. The Montreal Protocol includes a Multilateral Fund which could help finance HFC phase-down in developing countries.
Momentum on HFCs is also building at the national level and in the private sector. The EU, the US and China have all committed to controlling HFCs more stringently and increasing the availability of alternatives. A diverse group of governments, businesses and others is tackling HFCs through the Climate and Clean Air Coalition to Reduce Short-Lived Climate Pollutants (CCAC). The Consumer Goods Forum, with more than 400 member companies, will start phasing out HFCs in refrigeration in 2015.357 Refrigerants, Naturally! – an initiative by Coca-Cola, PepsiCo, Red Bull, Unilever and others – is working to eliminate the use of HFCs in those companies’ operations.358
Driving these actions is a strong sense of urgency. The HFCs now used as substitutes for ozone-depleting substances (ODSs) can trap 100–4,000 as much heat in the atmosphere over 100 years, per tonne, as CO2.359 And while proper handling and disposal can reduce emissions, every HFC-using device is a small “bank” of potential emissions for decades to come. Without fast action, the climate impact of HFCs could grow as much as 30-fold by 2050,360 eroding the benefits of global mitigation efforts.
Moreover, phasing down HFCs with high global warming potential (GWP) would cost relatively little. The US Environmental Protection Agency (EPA) estimates that HFC emissions could be reduced by more than 40% in 2030 through measures that are cost-effective today.361
Though in some areas (e.g. medical and technical aerosols, fire protection applications), there are still no good alternatives to high-GWP HFCs, in most areas they are widely available and affordable.362 The drinks manufacturer Heineken, which now uses non-HFC refrigeration where technically and legally feasible (about two-thirds of units worldwide), found HFC-free units cost about 15% more at first, but the price difference has narrowed as larger numbers were purchased. The new units are also 38% more energy-efficient than conventional ones, of which 10–15% is due to the refrigerant (hydrocarbons), and the rest to technological improvements.363 Coca-Cola, which had installed 1 million HFC-free coolers as of January 2014, reports a 40% improvement in its cooling equipment energy efficiency since 2000.364 Recent low-GWP refrigerant demonstration projects presented by the CCAC calculated energy savings of 15–30% and carbon footprint reductions of up to 60–85% for refrigeration in food stores.365
Overall, about 55% of HFCs used in 2010 were in residential, commercial and industrial refrigeration and air conditioning; another 24% were in mobile (vehicle) air conditioning; 11% in foams; 5% in aerosols; 4% in fire protection systems; and 1% in solvents.366 As in the food and beverage industry, HFC-free equipment in other sectors has been found to be more energy-efficient, reducing costs and GHG emissions.367
For motor vehicle air conditioning, for example, the replacement chosen by most automakers supplying EU, Japanese and North American markets costs about US$100 more per unit initially, and another US$2 each year. But the units save an estimated US$37–48 in fuel each year, paying for themselves in less than three years.368 Preliminary estimates by the Lawrence Berkeley National Laboratory (LBNL) also suggest that combining technically available energy efficiency improvements in room AC systems with a transition to low-GWP refrigerants would yield greater GHG emissions reductions than either measure alone.369 In India, the energy savings would be enough to avoid building 120 medium-sized power plants in the next 15 years.370
The Montreal Protocol has several advantages that would allow Parties to quickly and efficiently implement effective controls for HFCs, including a well-established infrastructure, expert panels, institutional experience phasing down nearly 100 similar chemicals, and dedicated implementation tools, including the Multilateral Fund.
The idea to bring HFCs under the Montreal Protocol was first proposed in 2009 by low-lying island states. Four proposals are now on the table, submitted by the Federated States of Micronesia, the Philippines, and six other island states; jointly by Mexico, Canada and the United States; by the European Union; and most recently by India, reversing its previous opposition. All focus on reducing HFC production and consumption under the Montreal Protocol, and leave accounting and reporting of HFCs under the UNFCCC.
The 2015 North American proposal suggests a staged phase-down, with developed countries starting right away and developing countries given a 10-year grace period, as was done with ozone-depleting substances. This measure could avoid an estimated 94–115 Gt CO2e of cumulative HFC emissions by 2050.371
A key strategy for slowing and reversing the growth in HFCs is to help countries that are currently phasing out hydrochlorofluorocarbons (HCFCs) under the Montreal Protocol to “leapfrog” over high-GWP HFCs and move directly to available low-GWP alternatives where feasible. Leapfrogging HFCs in the phase-out of HCFCs would be considerably less expensive than a conversion first from HCFCs to HFCs and then from HFCs to low-GWP alternatives. Combining this with energy efficiency improvements would provide added climate benefits – and cost savings – from reduced energy use.372
In April 2015, the Open Ended Working Group (OEWG) of the Montreal Protocol held an extraordinary meeting on HFCs, where countries agreed “to study the feasibility and ways of managing HFCs”, with a view to establishing a Contact Group at the OEWG meeting scheduled for 20–24 July in Paris. If progress continues, an HFC amendment could be adopted as soon as the Meeting of the Parties in Dubai in November 2015.
The UNFCCC could further speed the phase-down of high-GWP HFCs by encouraging Parties to include an HFC phase-down in their “intended nationally determined contributions” (INDCs) to the Paris climate agreement.373 The Parties could also extend HFC reporting and accounting requirements to developing countries.
We live in a moment of great opportunity. Subscribe to the New Climate Economy Newsletter to get up to date information on how we can build a better economy and a better climate together.
We never share your information or use it to spam you.
Borgmann, M., 2014. Dubai’s DEWA procures the world’s cheapest solar energy ever: Riyadh, start your photocopiers. Apricum GmbH, 27 November. Available at: http://www.apricum-group.com/dubais-dewa-procures-worlds-cheapest-solar-energy-ever-riyadh-start-photocopiers/.
See also: The Economist, 2015. Renewable Energy: Not a Toy. 11 April. Available at: http://www.economist.com/news/international/21647975-plummeting-prices-are-boosting-renewables-even-subsidies-fall-not-toy.↩
Van der Hoeven, M., 2015. Opportunity to act: Making smart decisions in a time of low oil prices. International Energy Agency presentation at the Oxford Energy Colloquium. Available at: http://www.iea.org/newsroomandevents/speeches/150127_OxfordEnergyColloquiumspeech.pdf.↩
Quandl, n.d. Natural Gas Prices and Charts. Available at: https://www.quandl.com/c/markets/natural-gas [accessed 24 April 2015].↩
IRENA, 2015. Renewable Power Generation Costs in 2014. International Renewable Energy Agency, Masdar City. Available at: http://www.irena.org/DocumentDownloads/Publications/IRENA_RE_Power_Costs_2014_report.pdf.↩
McCrone, A., Moslener, U., Usher, E., Grüning, C. and Sonntag-O’Brien, V. (eds.), 2015. Global Trends in Renewable Energy Investment 2015. Frankfurt School-UNEP Collaborating Centre for Climate & Sustainable Energy Finance, United Nations Environment Programme, and Bloomberg New Energy Finance. Available at: http://fs-unep-centre.org/publications/global-trends-renewable-energy-investment-2015.↩
Tesla Motors, 2015. Tesla Energy press kit. 30 April. Available at: http://www.teslamotors.com/presskit/teslaenergy.
See also: Naam, R., 2015. Why energy storage is about to get big – and cheap. Blog post, 14 April. Available at: http://rameznaam.com/2015/04/14/energy-storage-about-to-get-big-and-cheap/.↩
Smith, N., 2015. Clean Energy Revolution is Ahead of Schedule. Bloomberg View, 8 April. Available at: http://www.bloombergview.com/articles/2015-04-08/clean-energy-revolution-is-way-ahead-of-schedule.↩
McCrone et al., 2015. Global Trends in Renewable Energy Investment 2015.↩
Shearer, C., Ghio, N., Myllyvirta. L., and Nace, T., 2015. Boom and Bust: Tracking the Global Coal Plant Pipeline. Sierra Club. Available at: http://action.sierraclub.org/site/DocServer/Coal_Tracker_report_final_3-9-15.pdf?docID=17381.↩
McCrone et al., 2015. Global Trends in Renewable Energy Investment 2015.
IEA, 2014. World Energy Outlook 2014. International Energy Agency, Paris. Available at: http://www.oecd-ilibrary.org/ content/book/weo-2014-en.↩
Liebreich, M., 2015. State of the Industry Keynote. Presented at the Bloomberg New Energy Finance Annual Summit, New York, 14 April. Available at: http://about.bnef.com/presentations/liebreich-state-industry-keynote/.↩
Baffes, J., Kose, M.A., Ohnsorge, F. and Stocker, M., 2015. The Great Plunge in Oil Prices: Causes, Consequences and Policy Responses. World Bank Group, Washington, DC. Available at: http://www.worldbank.org/content/dam/Worldbank/Research/PRN01_Mar2015_Oil_Prices.pdf.↩
Blanchard, O., and Arezki, R, 2014. Seven Questions About the Recent Oil Price Slump. iMFdirect – The IMF Blog. International Monetary Fund, 22 December. Available at: http://blog-imfdirect.imf.org/2014/12/22/seven-questions-about-the-recent-oil-price-slump/.↩
Klevnäs, P., Stern, N. and Frejova, J., 2015. Oil Prices and the New Climate Economy. New Climate Economy briefing paper. Global Commission on the Economy and Climate and Stockholm Environment Institute, Stockholm. Available at: http://nce.habitatseven.work/misc/working-papers/.↩
FRED Federal Reserve Bank of St. Louis Economic Database↩
Ibid.↩
One estimate finds fossil fuel subsidies to have contributed a staggering 36% of global CO2 emissions in 1980–2010. See Stefanski, R., 2014. Dirty Little Secrets: Inferring Fossil-Fuel Subsidies from Patterns in Emission Intensities. Laval University and University of Oxford, April 2014. Available at: http://www.oxcarre.ox.ac.uk/files/OxCarreRP2014134%281%29.pdf.On health impacts of outdoor air pollution, see WHO, 2014. Ambient (outdoor) Air Quality and Health. Fact Sheet No. 313. World Health Organization, Geneva. Available at: http://www.who.int/ mediacentre/factsheets/fs313/en/.↩
The World Bank, 2015. Carbon Pricing Watch 2015: An Advance Brief from the State and Trends of Carbon Pricing 2015 Report, to Be Released Late 2015. Washington, DC. Available at: http://documents.worldbank.org/curated/en/2015/05/24528977/carbon-pricing-watch-2015-advance-brief-state-trends-carbon-pricing-2015-report-released-late-2015.↩
The World Bank and Ecofys, 2014. State and Trends of Carbon Pricing 2014. World Bank Group, Washington, DC. Available at: http://documents. worldbank.org/curated/en/2014/05/19572833/state-trends-carbon-pricing-2014. Updated in August 2014 for the New Climate Economy project, to reflect the removal of the Australian carbon pricing mechanism on 1 July 2014.↩
IEA, 2014, World Energy Outlook 2014.↩
del Granado, A.J., Coady, D., and Gillingham, R., 2010. The Unequal Benefits of Fuel Subsidies: A Review of Evidence for Developing Countries. International Monetary Fund, Washington, DC. , Available at: http://www.imf.org/external/pubs/ft/wp/2010/wp10202.pdf.↩
del Granado, A.J., Coady, D., and Gillingham, R., 2010. The Unequal Benefits of Fuel Subsidies: A Review of Evidence for Developing Countries. International Monetary Fund, Washington, DC. , Available at: http://www.imf.org/external/pubs/ft/wp/2010/wp10202.pdf.↩
See: https://g20.org/wp-content/uploads/2014/12/g20_note_global_infrastructure_initiative_hub.pdf.↩
See: http://www.worldbank.org/en/news/press-release/2014/10/09/world-bank-group-launches-new-global-infrastructure-facility↩
See: http://www.aiibank.org.↩
See: VI Brics Summit, 2014. Agreement on the New Development Bank. Fortaleza, Brazil, 15 July. Available at: http://brics6.itamaraty.gov.br/media2/press-releases/219-agreement-on-the-new-development-bank-fortaleza-july-15.↩
Swiss Re, 2014. Infrastructure Investing. It Matters. Swiss Reinsurance Company Ltd, , Zurich. Available at http://media.swissre.com/documents/Infrastructure_Investment_IIF.pdf.
OECD, 2015. Mapping Channels to Mobilise Institutional Investment in Sustainable Energy. Organisation for Economic Co-operation and Development, Paris. Available at: http://dx.doi.org/10.1787/9789264224582-en.
OECD, 2015. Policy Guidance for Investment in Clean Energy Infrastructure: Expanding Access to Clean Energy for Green Growth and Development. Organisation for Economic Co-operation and Development, Paris Available at: http://dx.doi.org/10.1787/9789264212664-en.↩
Bhattacharya, A., Oppenheim, J. and Stern, N., 2015 (forthcoming). Driving Better Growth through Better Infrastructure: Key Elements of a Transformation Program. New Climate Economy Working Paper. To be available at: http://nce.habitatseven.work/misc/working-papers/.↩
Blanchard, O., Furceri, D. and Pescatori, A., 2014. Chapter 8: A prolonged period of low, real interest rates? In Secular Stagnation: Facts, Causes and Cures. Teulings, C., and Baldwin, R. (eds). VoxEU and Centre for Economic Policy Research. Available at: http://www.voxeu.org/sites/default/files/Vox_secular_stagnation.pdf.
See also the book’s introduction, by C. Teulings and R. Baldwin.↩
IMF, 2014. World Economic Outlook April 2014: Recovery Strengthens, Remains Uneven. International Monetary Fund, Washington, DC. Available at: http://www. imf.org/external/Pubs/ft/weo/2014/01/.
Calderon, C., and Serven, L., 2014. Infrastructure, Growth and Inequality: An Overview. World Bank Group, Washington, DC. Available at: https://openknowledge.worldbank.org/handle/10986/20365.↩
Placeholder↩
Bhattacharya et al., 2015 (forthcoming). Driving Better Growth through Better Infrastructure.↩
Dabla-Norris, E., Brumby, J., Kyobe, J., Mills, Z., and Papageorgiou, C. 2012. Investing in Public Investment: An Index of Public Investment Efficiency. Journal of Economic Growth, 17 (3). 235–266. DOI: 10.1007/s10887-012-9078-5.
Gupta, S., Kangur, A., Papageorgiou, C., and Wane, A., 2014. Efficiency-Adjusted Public Capital and Growth. International Monetary Fund, Washington, DC. Available at: http://www.imf.org/external/pubs/ft/wp/2011/wp11217.pdf.
Rajaram, A., Kaiser, K., Le, T.M., Kim, J-H., and Frank, J., 2014. The Power of Public Investment Management: Transforming Resources into Assets for Growth. World Bank Group, Washington, DC. Available at: http://documents.worldbank.org/curated/en/2014/09/20268592/power-public-investment-management-transforming-resources-assets-growth.↩
See UN Climate Summit, 2014. Resilience: Integrating Risks into the Financial System: The 1-in-100 Initiative Action Statement. Available at: http://www.un.org/climatechange/summit/wp-content/uploads/sites/2/2014/09/RESILIENCE-1-in-100-initiative.pdf.
Willis, 2014. Willis-Led Disaster Resilience Initiative Receives United Nations Endorsement. Press release, 28 November. Available at: http://investors.willis.com/phoenix.zhtml?c=129857&p=irol-newsArticle&id=1993789.↩
UNEP. 2015. The Coming Financial Climate: The Inquiry’s 4th Progress Report. Inquiry into the Design of a Sustainable Financial System: Policy Innovations for a Green Economy. United Nations Environment Programme, Geneva. Available at: http://www.unep.org/inquiry/Portals/50215/Documents/ES_English.pdf.↩
Ibid.↩
G20, 2015. Communiqué: G20 Finance Ministers and Central Bank Governors Meeting. Available at: https://g20.org/wp-content/uploads/2015/04/April-G20-FMCBG-Communique-Final.pdf.↩
BP, 2015. Annual General Meeting. Available at: http://www.bp.com/en/global/corporate/investors/annual-general-meeting.html.
Shell, 2015. 2015 Annual General Meeting. Available at: http://www.shell.com/global/aboutshell/investor/shareholder-information/agm/2015.html.↩
Ceres, 2015. Investors push SEC to require stronger climate risk disclosure by fossil fuel companies. Press release, 17 April. Available at: http://www.ceres.org/press/press-releases/investors-push-sec-to-require-stronger-climate-risk-disclosure-by-fossil-fuel-companies.↩
For a full list, see: http://gofossilfree.org/commitments/.↩
Ministry of Finance of Norway, 2015. New Climate Criterion for the Exclusion of Companies from the Government Pension Fund Global (GPFG). Press release, 10 April. Available at: https://www.regjeringen.no/en/aktuelt/nytt-klimakriterium-for-utelukkelse-av-selskaper/id2405205/.↩
See: http://www.unep.org/inquiry.↩
Zhang, C., Zadek, S., Chen, N., and Halle, M., 2015. Greening China’s Financial System: Synthesis Report. International Institute for Sustainable Development and China Development Research Center. Available at: https://www.iisd.org/publications/greening-chinas-financial-system.↩
Zuckerman, J., Nelson, D. and Frejova, J., 2015. Chapter 3: Clean Energy Finance. In International Cooperation in the New Climate Economy: Accelerating Growth and Climate Action, 2015. New Climate Economy.↩
Bank of America, 2014. Bank of America Announces $10 Billion Catalytic Finance Initiative to Accelerate Clean Energy Investments that Reduce Carbon Emissions. Press release, 23 September. Available at : http://newsroom.bankofamerica.com/press-releases/corporate-and-investment-banking-sales-and-trading-treasury-services/bank-america-ann. Citi, n.d. Environmental Finance. Available at: http://www.citigroup.com/citi/environment/opportunities.htm [accessed 4 June, 2015].↩
The World Bank, 2012. Inclusive Green Growth: The Pathway to Sustainable Development. Washington, DC. Available at: http://siteresources.worldbank.org/EXTSDNET/Resources/Inclusive_Green_Growth_May_2012.pdf.
See also: Green Growth Knowledge Platform: http://www.greengrowthknowledge.org.
Green Growth Best Practice Network, 2014. Green Growth in Practice: Lessons from Country Experiences. Available at: http://www.greengrowthknowledge.org/resource/green-growth-practice-lessons-country-experiences.↩
Government of Rwanda, 2011. Green Growth and Climate Resilience: National Strategy for Climate Change and Low Carbon Development. Kigali. Available at http://cdkn.org/wp-content/uploads/2010/12/Rwanda-Green-Growth-Strategy-FINAL1.pdf↩
Federal Democratic Republic of Ethiopia, 2011. Ethiopia’s Climate-Resilient Green Economy. Available at: http://www.undp.org/content/dam/ethiopia/docs/Ethiopia%20CRGE.pdf. Ethiopia’s New Climate Economy Partnership, n.d. Unlocking the Power of Ethiopia’s Cities. Ethiopian Development Research Institute (EDRI) and the Global Green Growth Institute (GGGI). Available at: http://static.newclimateeconomy.report/wp-content/uploads/2015/03/Unlocking-the-Power-of-Cities-in-Ethiopia.pdf↩
Africa Progress Panel, 2015. Power, People, Planet: Seizing Africa’s Energy and Climate Opportunities. Africa Progress Report 2015. Geneva Available at: http://www.africaprogresspanel.org/publications/policy-papers/2015-africa-progress-report/.↩
Ibid.↩
Cheung, R., Delio, E., Lall, S., Bairiganjan, S., Fuente, D. and Singh, S., 2010. Power to the People: Investing in Clean Energy for the Base of the Pyramid in India. Centre for Development Finance, Institute for Financial Management & Research, and World Resources Institute, Chennai, India. Available at: http://www.wri.org/publication/power-people.↩
BP, 2015. BP Statistical Review of World Energy June 2015. Available at: http://www.bp.com/en/global/corporate/about-bp/energy-economics/statistical-review-of-world-energy.html.
Green, F., and Stern, N., 2015. China’s “New Normal”: Structural Change, Better Growth, and Peak Emissions. Grantham Research Institute on Climate Change and Environment and Centre for Climate Change Economics and Policy. Available at: http://www.lse.ac.uk/GranthamInstitute/wp-content/uploads/2015/06/Chinas_new_normal_green_stern_June_2015.pdf.↩
IRENA, 2015. Renewable Energy Capacity Statistics 2015. International Renewable Energy Agency, Masdar City. Available at: http://www.irena.org/DocumentDownloads/Publications/IRENA_RE_Capacity_Statistics_2015.pdf.↩
China Dialogue, 2011. China’s Green Revolution: Energy, Environment and the 12th Five-Year Plan. Beijing. Available at: https://www.chinadialogue.net/UserFiles/File/PDF_ebook001.pdf.↩
The Green Growth Knowledge Platform (http://www.greengrowthknowledge.org/), the Low Emissions Development Global Partnership (http://ledsgp.org/about/how), the Climate and Development Knowledge Network (http://cdkn.org) and the Global Green Growth Institute (http://www.gggi.org) are among initiatives providing resources for learning and dissemination of best practice in low-carbon development and growth strategies.↩
IEA, 2015. World Energy Outlook 2015 Special Report on Energy and Climate Change. International Energy Agency, Paris. Available at: http://www.worldenergyoutlook.org.↩
IEA, 2015. World Energy Outlook 2015 Special Report on Energy and Climate Change.↩
Bloomberg Business, 2015. China Carbon Emissions Decline as 2014 Global CO2 Stays Flat. 13 March. Available at: http://www.bloomberg.com/news/articles/2015-03-13/china-s-carbon-emissions-drop-for-the-first-time-since-2001.↩
IEA, 2015. Energy Technology Perspectives 2015 – Mobilising Innovation to Accelerate Climate Action. International Energy Agency, Paris. Available at: http://www.iea.org/etp/etp2015/.
The energy intensity of GDP provides a rough index of the efficiency of energy use, although it also reflects a variety of other influences such as structural change in the economy. The carbon intensity of energy mainly reflects the proportion of fossil fuels in the overall energy fuel mix.↩
Data sources for Table 1 are:The World Bank, n.d. GDP growth. World Development Indicators. Available at: http://data.worldbank.org/indicator/NY.GDP.MKTP.KD.ZG.IEA, 2014. World Energy Balances 2014. International Energy Agency, Paris. Available at: http://www.iea.org/statistics/topics/energybalances/.Global Carbon Project, 2014. Carbon Budget 2014: A Global Update of the Carbon Budget and Trends. Available at: http://www.globalcarbonproject.org/carbonbudget/.BP, 2014. BP Statistical Review of World Energy June 2014. London. Available at: http://www.bp.com/statisticalreview.Where data are incomplete, NCE staff have made calculations and estimates. Growth rates are estimated by regression of log variables on a linear time trend.↩
See: WTO, 2015. Modest trade recovery to continue in 2015 and 2016 following three years of weak expansion. World Trade Organization press release, 14 April. Available at: https://www.wto.org/english/news_e/pres15_e/pr739_e.htm.↩
See, e.g.: Inman, P., 2015. World Bank’s Jim Kim global slowdown harm anti-poverty drive. The Guardian, 16 April. Business. Available at: http://www.theguardian.com/business/2015/apr/16/world-banks-jim-kim-warns-global-slowdown-will-harm-anti-poverty-drive.↩
The World Bank, 2015. Poverty Overview. Available at: http://www.worldbank.org/en/topic/poverty/overview. [Last updated 6 April 2015.]↩
Evidence in this paragraph summarized in Miren Gutierrez, Will McFarland and Lano Fonua, 2014. Zero poverty … think again. Impact of climate change on development efforts. Overseas Development Institute (available at http://www.odi.org/sites/odi.org.uk/files/odi-assets/publications-opinion-files/8863.pdf), and in Ilmi Granoff, Jason Eis, Chris Hoy, Charlene Watson, Amina Khan and Natasha Grist, 2014. Targeting Zero-Zero. Achieving zero extreme poverty on the path to zero net emissions. Overseas Development Institute (available at: http://www.developmentprogress.org/sites/developmentprogress.org/files/case-study-report/zero_zero_discussion_paper_full.pdf).↩
Global Environmental Facility, n.d. Strategy on Adaptation to Climate Change for the Least Developed Countries Fund (LDCF) and Special Climate Change Fund (SCCF). Available at: https://www.thegef.org/gef/sites/thegef.org/files/publication/GEF-ADAPTION%20STRATEGIES.pdf.
UNDP, 2010.Designing Climate Change Adaptation Initiatives: A UNDP Toolkit for Practitioners. Available at: https://sustainabledevelopment.un.org/content/documents/951013_Toolkit%20for%20Designing%20Climate%20Change%20Adaptation%20Initiatives.pdf.
World Bank, n.d. World Bank Climate Change Adaptation Note Series. Available at: http://www.seachangecop.org/taxonomy/term/623.↩
Fay, M. Hallegatte, S., Vogt-Schlib, A., Rozenberg, J., Narloch, U., and Kerr, T., 2015. Decarbonizing Development: Three Steps to a Zero-Carbon Future. The World Bank, Washington, DC. Available at: http://www.worldbank.org/content/dam/Worldbank/document/Climate/dd/decarbonizing-development-report.pdf.
OECD, IEA, ITF and NEA, 2015. Aligning Policies for a Low-Carbon Economy. Organisation for Economic Co-operation and Development, International Energy Agency, Nuclear Energy Agency, and International Transport Forum, Paris. Available at: http://www.oecd.org/environment/aligning-policies-for-a-low-carbon-economy-9789264233294-en.htm.↩
OECD, IEA, ITF and NEA, 2015. Aligning Policies for a Low-Carbon Economy.↩
ITUC, 2009. What’s Just Transition? International Trade Union Confederation, Brussels. Available: http://www.ituc-csi.org/IMG/pdf/01-Depliant-Transition5.pdf.
ITUC, 2015. Frontlines Briefing – Climate Justice: Unions4Climate Action. International Trade Union Confederation, Brussels. Available at: http://www.ituc-csi.org/IMG/pdf/ituc_frontlines_climate_change_report_may_en.pdf.↩
MarketsandMarkets, 2015. Solar Power Market by PV, CSP Technologies by Installations, Price, Cost, Trade Trends & Global Forecasts (2011-2016). Dallas, TX. Available at: http://www.marketsandmarkets.com/PressReleases/solar-energy.asp.↩
See: The White House, 2014. Promoting Green Goods Trade to Address Climate Change. The White House Blog, 24 January. Available at: http://www.whitehouse.gov/blog/2014/01/24/promoting-green-goods-trade-address-climate-change. See also Chapter 8 in Better Growth, Better Climate.↩
See Chapter 8 in Better Growth, Better Climate.↩
OECD, 2013. “OECD Policy Guidance for Investment in Clean Energy Infrastructure: Expanding Access to Clean Energy for Green Growth and Development”; OECD (2015), Overcoming Barriers to International Investment in Clean Energy, OECD, Paris.↩
Important questions remain to be resolved about what kinds of finance should count towards the US$100 billion commitment, particularly what can legitimately be counted as “mobilised” by developed countries. See, e.g., Bodnar, P., Brown, J., and Nakhooda, S., 2015 (forthcoming). What Counts? Tools to Help Define the $100 Billion Commitment. Climate Policy Initiative, Overseas Development Institute and World Resources Institute.
See also the Standing Committee on Finance, 2014. 2014 Biennial Assessment and Overview of Climate Finance Flows Report. United Nations Framework Convention on Climate Change, Bonn. Available at: http://unfccc.int/cooperation_and_support/financial_mechanism/standing_committee/items/8034.php.
Westphal, M., Canfin, P., Ballesteros, A., and Morgan, J., 2015. Getting to $100 Billion: Climate Finance Scenarios and Projections to 2020. World Resources Institute, Washington, DC. Available at: http://www.wri.org/publication/getting-100-billion-climate-finance-scenarios-and-projections-2020.↩
Westphal, M., Canfin, P., Ballesteros, A., and Morgan, J., 2015. Getting to $100 Billion: Climate Finance Scenarios and Projections to 2020. World Resources Institute, Washington, DC. Available at: http://www.wri.org/publication/getting-100-billion-climate-finance-scenarios-and-projections-2020.↩
See the proposal for an “integrated roadmap to finance the low-carbon economy” set out in the report of the “Hollande Commission”: Canfin, P., and Grandjean, A., 2015. Mobilizing Climate Finance: A Roadmap to Finance a Low-Carbon Economy. Government of France, Paris.↩
See Chapter 8 in Better Growth, Better Climate.↩
For a list of INDCs (and the full documents), see: http://www4.unfccc.int/submissions/indc/Submission%20Pages/submissions.aspx.↩
An assessment of the degree of effort of published INDCs is given at Climate Action Tracker, n.d. Tracking INDCs. Available at: http://climateactiontracker.org/.↩
Belenky, M., n.d.. Paris Analysis: Mind the Gap. Climate Advisers. Available at: http://www.climateadvisers.com/mindthegap/ [accessed 4 June 2015]. See also Climate Action Tracker: http://climateactiontracker.org.
2010 emissions estimate is from IPCC, 2014. Summary for Policymakers. In Climate Change 2014: Mitigation of Climate Change. Contribution of Working Group III to the Fifth Assessment Report of the Intergovernmental Panel on Climate Change. O. Edenhofer, R. Pichs-Madruga, Y. Sokona, E. Farahani, S. Kadner, et al. (eds.). Cambridge University Press, Cambridge, UK, and New York. Available at: https://www.ipcc.ch/report/ar5/wg3/.↩
New Climate Economy. 2015. “Estimates of Emissions Reduction Potential for the 2015 Report: Technical Note.” A technical note for Seizing the Global Opportunity: Partnerships for Better Growth and a Better Climate. Available at: http://nce.habitatseven.work/misc/working-papers.
The estimates for the emissions reduction potential of the actions proposed in this report are from a “business as usual” baseline in which no climate action is taken after 2010. They therefore include the potential of some actions already being taken or planned, as well as those recommended in the report. (In many cases it is not yet clear what the precise impact of actions already being taken or planned will be; hence it is difficult to calculate the “additional” impact of stronger action.)
The estimates made for this report are mostly ranges to allow for various uncertainties, with the median values expressed in Figure 4. The emissions potential of the actions in each area have been estimated individually; when added together the overlaps between them have been subtracted, using conservative assumptions.
The baseline is taken from modelling scenarios reviewed by the IPCC and analysed in: UNEP, 2014. The Emissions Gap Report 2014. United Nations Environment Programme, Nairobi. Available at: http://www.unep.org/publications/ebooks/emissionsgapreport2014/. That report estimates the median level of emissions in 2030 as 69 Gt CO2e.
Also using IPCC modelling scenarios, the UNEP report identifies 42 Gt CO2e as the median of the emissions range (30–44 Gt CO2e) required in 2030 for a 50–66% likelihood of holding the rise in average global temperature to 2°C. This is also used in this report. The difference between the baseline of 69 Gt CO2e and the “required level” of 42 Gt CO2e gives a gross “emissions gap” in 2030 (before any action is taken) of 27 Gt CO2e.
The actions proposed in this report are estimated to have an aggregate emissions reduction potential in 2030 of 15–26 Gt CO2e once the overlaps between them have been subtracted. This represents 59–96% of the gross emissions gap. A full description of the methodology used to estimate the emissions reduction potential in this report is published at http://static.newclimateeconomy.report/wp-content/uploads/2015/07/estimates-of-emissions-reduction-potential-for-the-2015-report.pdf.↩
The principle of “no backsliding”, which was agreed at the Lima Climate Change Conference in December 2014, is important. Countries should be allowed to raise the ambition of their INDCs, but not to weaken them.↩
See the UNFCCC listing of INDCs: http://www4.unfccc.int/submissions/indc/Submission%20Pages/submissions.aspx.↩
For a list and survey, see Harrison, N., Bartlett, N., Höhne, N., Braun, N., Day, T., Deng, Y., and Dixson-Declève, S., 2014. Enhancing Ambition through International Cooperative Initiatives. Nordic Council of Ministers, Copenhagen, Available at: http://norden.diva-portal.org/smash/get/diva2:713496/FULLTEXT01.pdf.
See also the Climate Initiatives Platform: http://climateinitiativesplatform.org.↩
See: http://www.un.org/climatechange/summit/.
For an analysis of these initiatives, see: Hsu, A., Moffat, A. S., Weinfurter, A. J. and Schwartz, J. D., 2015. Towards a new climate diplomacy. Nature Climate Change, 5(6). 501–503. DOI:10.1038/nclimate2594.↩
COP20/CMP10 Presidency, 2015. Lima – Paris Action Agenda Statement. Press release, 14 January. Available at: http://www.cop20.pe/en/18732/comunicado-sobre-la-agenda-de-accion-lima-paris/.↩
See http://climateaction.unfccc.int and http://climateinitiativesplatform.org.↩
See: http://www.ghgprotocol.org.↩
See: http://static.newclimateeconomy.report/wp-content/uploads/2015/07/estimates-of-emissions-reduction-potential-for-the-2015-report.pdf↩
See detailed explanation in note 79 above.↩
New Climate Economy analysis. For further information and analysis supporting this figure, please see Estimates of Emissions Reduction Potential for the 2015 Report: Technical Note. Available at: http://nce.habitatseven.work/misc/working-papers↩
United Nations, 2014. World Urbanization Prospects, the 2014 Revision. UN Department of Economic and Social Affairs, Population Division. Available at: http://esa.un.org/unpd/wup/. For detailed data, see: http://esa.un.org/unpd/wup/CD-ROM/Default.aspx.↩
New Climate Economy analysis based on data from Oxford Economics and LSE Cities, 2015. See Floater, G., Rode, P., Robert, A., Kennedy, C., Hoornweg, D., Slavcheva, R. and Godfrey, N., 2014. Cities and the New Climate Economy: the Transformative Role of Global Urban Growth. New Climate Economy contributing paper. Available at: http://newclimateeconomy.report/2015/misc/working-papers/.↩
The Intergovernmental Panel on Climate Change (IPCC) estimates that in 2010, urban areas accounted for 67–76% of global energy use and 71–76% of global CO2 emissions from final energy use. See: Seto, K. C. and Dhakal, S., 2014. Chapter 12: Human settlements, infrastructure, and spatial planning. In Climate Change 2014: Mitigation of Climate Change. Contribution of Working Group III to the Fifth Assessment Report of the Intergovernmental Panel on Climate Change. O. Edenhofer, R. Pichs-Madruga, Y. Sokona, E. Farahani, S. Kadner, et al. (eds.). Cambridge University Press, Cambridge, UK, and New York. Available at: https://www.ipcc.ch/report/ar5/wg3/.↩
C40 Cities Climate Leadership Group, Arup, Local Governments for Sustainability (ICLEI), World Resources Institute (WRI), UN Habitat, UN Special Envoy, United Cities and Local Governments (UCLG), carbonn Climate Registry and CDP, 2014. Global Aggregation of City Climate Commitments. Available at: http://publications.arup.com/Publications/G/Global_Aggregation_of_City_Climate_Commitments.aspx.↩
The Compact of States and Regions was formed in 2014, bringing together the separate associations of the Climate Group States & Regions Network, R20 and nrg4SD. See http://www.theclimategroup.org/what-we-do/programs/compact-of-states-and-regions/.↩
We present only a very brief summary of the analysis here. For a detailed description, including assumptions, see Gouldson, A., Colenbrander, S., Godfrey, N., Sudmant, A. and Zhao, X. 2015. Accelerating Low-Carbon Development in the World’s Cities. A New Climate Economy contributing paper for Seizing the Global Opportunity: Partnerships for Better Growth and a Better Climate. Available at: http://newclimateeconomy.report/2015/misc/working-papers.↩
See: Erickson, P. and Tempest, K., 2014. Advancing Climate Ambition: Cities as Partners in Global Climate Action. Produced by SEI in support of the UN Secretary-General’s Special Envoy for Cities and Climate Change and C40. Stockholm Environment Institute, Seattle, WA, US. Available at: http://sei-international.org/publications?pid=2577.
For a more detailed discussion, see: Erickson, P. and Tempest, K., 2014. Advancing Climate Ambition: How City-Scale Actions Can Contribute to Global Climate Goals. SEI Working Paper No. 2014-06. Stockholm Environment Institute, Seattle, WA, US. Available at: http://sei-international.org/publications?pid=2582.↩
Based on data from Erickson and Tempest, 2014. Advancing Climate Ambition.↩
Business-as-usual or baseline energy intensities, energy use and activity levels are based on the 4DS scenario in:
IEA, 2014. Energy Technology Perspectives 2014: Harnessing Electricity’s Potential. International Energy Agency, Paris. Available at: http://www.iea.org/etp/.
IEA, 2012. Energy Technology Perspectives 2012: Pathways to a Clean Energy System. International Energy Agency, Paris. Available at: http://www.iea.org/etp/publications/etp2012.
Estimates of energy savings and mitigation potential are drawn from Erickson and Tempest, 2014, who base their estimate on scenarios developed by the IEA, the Global Buildings Performance Network, and the International Council on Clean Transportation.
Data on incremental investment needs for transport sector are drawn from the IEA’s cost database for energy efficiency; see: IEA, 2014. World Energy Investment Outlook 2014. International Energy Agency, Paris. Available at: https://www.iea.org/publications/freepublications/publication/world-energy-investment-outlook—special-report—.html.
Capital, operating and maintenance costs of public transport are drawn from Dulac, J., 2013. Global Land Transport Infrastructure Requirements: Estimating Road and Railway Infrastructure and Capacity Costs to 2050. International Energy Agency, Paris. Available at: https://www.iea.org/publications/freepublications/publication/global-land-transport-infrastructure-requirements.html.
Cost data for the buildings sector are drawn from: Ürge-Vorsatz, D., Reith, A., Korytárová, K., Egyed M., and Dollenstein J., 2015. Monetary Benefits of Ambitious Building Energy Policies. Research report prepared by Advanced Building and Urban Design for the Global Building Performance Network (GBPN). Available at: http://www.gbpn.org/reports/monetary-benefits-ambitious-building-energy-policies.
Cost data for the waste sector are drawn from: WEC and BNEF, 2013. World Energy Perspective: Cost of Energy Technologies. World Energy Council and Bloomberg New Energy Finance. Available at: http://www.worldenergy.org/wp-content/uploads/2013/09/WEC_J1143_CostofTECHNOLOGIES_021013_WEB_Final.pdf.
Full details of the data sources, methods and assumptions behind the analysis, and a comparison with other estimates, are presented in Gouldson et al., 2015, Accelerating Low-Carbon Development in the World’s Cities.↩
Under the “low”, “medium” and “high” scenarios, the real discount rates used are 1.4%, 3% and 5%, and the increases in real energy prices are 1%, 2.5% and 4%. Learning rates are sector- and technology-specific.↩
Gouldson et al., 2015. Accelerating Low-Carbon Development in the World’s Cities.↩
WHO, 2015. Road Traffic Injuries: Fact sheet 358. World Health Organization. Available at http://www.who.int/mediacentre/factsheets/fs358/en/.↩
Global Commission on the Economy and Climate, 2014. New Climate Economy Technical Note: Infrastructure Investment Needs of a Low-Carbon Scenario. Supporting paper for the New Climate Economy. Available at: http://newclimateeconomy.report/2015/misc/working-papers/.↩
Zhang, M., 2009. Bus versus rail: Meta-analysis of cost characteristics, carrying capacities, and land use impacts. Transportation Research Record: Journal of the Transportation Research Board, 2110. 87–95. DOI:10.3141/2110-11.↩
Pucher, J. and Buehler, R., 2008. Making cycling irresistible: Lessons from The Netherlands, Denmark and Germany. Transport Reviews, 28(4). 495–528. DOI:10.1080/01441640701806612.
Mahendra, A., Conti, V., Pai, M. and Rajagopalan L., 2014. Integrating Health Benefit into Transportation Planning in Ppolicy in India. World Resources Institute and EMBARQ. Available at: http://www.wricities.org/sites/default/files/Health-Impact-Assessments-Transport-EMBARQ-India-4.pdf.↩
Pucher, J. and Buehler, R., 2012. City Cycling. Massachusetts Institute of Technology (MIT). Cambridge, USA. 1–2. Available at: http://mitpress.mit.edu/books/city-cycling-0.↩
The World Bank, 2013. Planning and Financing Low-Carbon, Livable Cities. Washington, DC. Available at: http://www.worldbank.org/en/news/feature/2013/09/25/planning-financing-low-carbon-cities.↩
Organisation for Economic Co-operation and Development (OECD), 2015. Governing the City. Paris. Available at: http://dx.doi.org/10.1787/9789264226500-en.↩
The World Bank, 2013. Financing Sustainable Cities: How We’re Helping Africa’s Cities Raise Their Credit Ratings. Available at: http://www.worldbank.org/en/news/feature/2013/10/24/financing-sustainable-cities-africa-creditworthy.↩
Based on an average cost of technical assistance of US$2 million per city. NCE estimates based on consultation with a range of city-focused institutions.↩
We present only a very brief summary of the analysis here. For a detailed description, including assumptions, see Gouldson et al., 2015. Accelerating Low-Carbon Development in the World’s Cities.↩
Based on the assumption that technical assistance would represent 2.5-5% of total project costs after leveraged investments. NCE estimates based on consultation with a range of city-focused institutions.↩
We assume the population growth rate to 2040 to be 0.86% per year, following the UN’s medium-variant estimate to 2050. Similarly, the urban population is projected to grow about 1.6% per year over this period, and this can be used as a proxy for growth of the middle class to a lower bound of 3 billion. An upper bound is derived from an OECD estimate of 4.9 billion middle-class people in 2030. The central tendency of 4 billion seems reasonable, recognising the uncertainties in predicting global household income distribution patterns 15 years in advance.
See: United Nations, 2012. World Population Prospects: The 2012 Revision. UN Department of Economic and Social Affairs, Population Division, New York. Available at: http://esa.un.org/unpd/wpp/..
For the OECD estimate, see: Pezzini, M., 2012. An emerging middle class. OECD Yearbook 2012. Available at: http://www.oecdobserver.org/news/fullstory.php/aid/3681/An_emerging_middle_class.html. ↩
Searchinger, T., Hanson, C., Ranganathan, J., Lipinski, B., Waite, R., Winterbottom, R., Dinshaw, A., and Heimlich, R., 2013. Creating a Sustainable Food Future: A Menu of Solutions to Sustainably Feed More than 9 Billion People by 2050. World Resources Report 2013–14: Interim Findings. World Resources Institute, the World Bank, United Nations Environment Programme, and United Nations Development Programme, Washington, DC. Available at: http://www.wri.org/publication/creating-sustainable-food-future-interim-findings.
Elias, P. and Boucher, D., 2014. Planting for the Future: How demand for wood products could be friendly to tropical forests. Union of Concerned Scientists, Cambridge, MA. October. Available at: http://newgenerationplantations.org/multimedia/file/9f447ff6-5935-11e4-a16a-005056986313.
WWF, 2012. Chapter 4: Forests and Wood Products. In WWF Living Forest Report. Washington, DC. Available at: http://wwf.panda.org/about_our_earth/deforestation/forest_publications_news_and_reports/living_forests_report/. ↩
FAO, 2011. The State of the World’s Land and Water Resources for Food and Agriculture (SOLAW) – Managing Systems at Risk. Food and Agriculture Organization of the United Nations, Rome. Available at: http://www.fao.org/nr/solaw/. ↩
UNCCD, 2012. Some Global Facts & Figures. United Nations Convention to Combat Desertification Available at: http://www.unccd.int/en/programmes/Event-and-campaigns/WDCD/Documents/DLDD%20Facts.pdf. ↩
FAO, n.d. Land degradation assessment. Food and Agriculture Organization of the United Nations, Rome. Available at: http://www.fao.org/nr/land/degradation/en/ [accessed 4 June 2015]. ↩
FAO, 2010. Global Forest Resources Assessments 2010. Food and Agriculture Organization of the United Nations, Rome. Available at: www.fao.org/forestry/fra/en. ↩
Minnemeyer, S., Laestadius, L., Sizer, N., Saint-Laurent, C., and Potapov, P., 2011. A World of Opportunity. Global Partnership on Forest Landscape Restoration. Available at: http://www.wri.org/sites/default/files/world_of_opportunity_brochure_2011-09.pdf. ↩
The Prince’s Charities International Sustainability Unit, 2015. Tropical Forests: A Review. London. Available at: http://www.pcfisu.org/wp-content/uploads/2015/04/Princes-Charities-International-Sustainability-Unit-Tropical-Forests-A-Review.pdf. ↩
FAO, n.d. Composition of agricultural area 1962–2012. FAO Stats. Food and Agriculture Organization of the United Nations, Rome. Available at: http://faostat3.fao.org/faostat-gateway/go/to/browse/R/RL/E [accessed 14 August 2014]. ↩
Lawson, S., 2014. Consumer Goods and Deforestation: An Analysis of the Extent and Nature of Illegality in Forest Conversion for Agriculture and Timber Plantations. Forest Trends, Washington, DC. Available at: http://www.forest-trends.org/documents/files/doc_4718.pdf. ↩
Houghton, R. A., 2013. The emissions of carbon from deforestation and degradation in the tropics: past trends and future potential. Carbon Management, 4(5). 539–546. DOI:10.4155/cmt.13.41. ↩
The per hectare estimates are from: TEEB, 2010. The Economics of Ecosystems and Biodiversity Ecological and Economic Foundations. R. Kumar, ed. Earthscan, London and Washington. Available at: http://www.teebweb.org/publication/the-economics-of-ecosystems-and-biodiversity-teeb-ecological-and-economic-foundations.
Costanza, R., de Groot, R., Sutton, P., van der Ploeg, S., Anderson, S.J., Kubiszewski, I., Farber, S. and Turner, R.K., 2014. Changes in the global value of ecosystem services. Global Environmental Change, 26. 152–158. DOI:10.1016/j.gloenvcha.2014.04.002.
The International Resource Panel Report (in conjunction with UN REDD+). Available at http://www.unep.org/resourcepanel/Publications/BuildingNaturalCapitalHowREDD/tabid/132320/Default.aspx. ↩
See: http://www.un-redd.org/portals/15/documents/ForestsDeclarationText.pdf. The New York Declaration built on the Bonn Challenge of 2011, in which governments had pledged to put 150 million ha of forest into restoration by 2020. As of May 2015, 11 countries had made commitments covering 59.2 million ha. See: http://www.bonnchallenge.org.
Forest landscape restoration means re-growing whole forests on a large scale, but very often will involve reforesting tracts of land such as steep slopes, the tops of hills, and river borders within a broader “mosaic landscape”, in addition to agroforestry. See: Wolosin, M. 2014. Quantifying the Benefits of the New York Declaration on Forests. Climate Advisers. Available at: http://www.climateadvisers.com/quantifying-the-benefits-of-the-new-york-declaration-on-forests. ↩
The Netherlands played a key leadership role in the development of climate-smart agriculture between 2011 and 2014. See: https://www.wageningenur.nl/en/Dossiers/file/Dossier-Climate-Smart-Agriculture.htm. ↩
See: http://www.cgiar.org and http://www.globalresearchalliance.org. ↩
Ouya, D., 2014. A new alliance to spread climate smart agriculture among millions of smallholder farmers in Africa. Agroforestry World Blog, 8 December. Available at: http://blog.worldagroforestry.org/index.php/2014/12/08/a-new-alliance-to-spread-climate-smart-agriculture-among-millions-of-smallholder-farmers-in-africa/. ↩
The global nature of supply chain commitments is critical to ensuring that forest loss and ecosystem destruction is reduced rather than simply displaced. For example, there is evidence that traders in the EU have successfully eliminated Amazon deforestation from their soy supply in part by substituting soy produced on newly cleared land in the neighbouring Cerrado.
See: Godar, J., Persson, U.M., Tizado, E.J. and Meyfroidt, P., 2015. Towards more accurate and policy relevant footprint analyses: Tracing fine-scale socio-environmental impacts of production to consumption. Ecological Economics, 112, 25–35. DOI: 10.1016/j.ecolecon.2015.02.003. ↩
Consumer Goods Forum, n.d. Board Resolution on Deforestation. Available at: http://www.theconsumergoodsforum.com/strategic-focus/sustainability/board-resolution-on-deforestation [accessed 18 May 2015]. ↩
See: http://www.tfa2020.com. ↩
See: World Economic Forum, 2015. World Economic Forum to Host Tropical Forest Alliance 2020 Secretariat. Press release, 23 January. Available at: http://www.weforum.org/news/world-economic-forum-host-tropical-forest-alliance-2020-secretariat. ↩
FAO, 2011. The State of the World’s Land and Water Resources for Food and Agriculture.
A net 260 million ha of forest were eliminated in Africa, Asia, Central and South America combined between 1990 and 2012; a net 10 million ha of forest were added in Europe and North America combined. See: http://faostat3.fao.org/download/G2/GF/E. ↩
Parker, C., Cranford, M., Oakes, N. and Leggett, M. (eds.), 2012. The Little Biodiversity Finance Book. Global Canopy Programme, Oxford. Available at: http://www.globalcanopy.org/sites/default/files/LittleBiodiversityFinanceBook_3rd%20edition.pdf. This citation gives estimates of “biodiversity finance”, but this is taken as a good indicator of both conservation and landscape restoration finance. ↩
Credit Suisse, WWF, and McKinsey & Co., 2014. Conservation Finance: Moving beyond donor funding toward an investor-driven approach. Available at: https://www.credit-suisse.com/media/cc/docs/responsibility/conservation-finance-en.pdf. ↩
Lowder, S., Carisma, B. and Skoet, J. 2012. Who invests in agriculture and how much?: An empirical review of the relative size of various investments in agriculture in low- and middle-income countries . FAO, Rome. ESA Working paper No. 12-09. Available at: http://www.fao.org/3/a-ap854e.pdf. ↩
The Global Impact Investing Network (GIIN) is a non-profit organisation dedicated to increasing the effectiveness of impact investing; its website contains useful definitions and a large amount of relevant information. See: http://www.thegiin.org/cgi-bin/iowa/aboutus/index.html.
A sense of the culture and dynamic of impact investing is also found at: Clark, C., Emerson, J. and Thornley, B., 2012. The Impact Investor: People & Practices Delivering Exceptional Financial & Social Returns. Special Report. Insight at Pacific Community Ventures, Duke Case Center for the Advancement of Social Entrepreneurship, and Impact Assets. San Francisco. Available at: http://www.pacificcommunityventures.org/uploads/reports-and-publications/The_Six_Dynamics_of_Impact_Investing_October_2012_PCV_CASE_at_Duke_ImpactAssets.pdf. ↩
From a limited sample of 51 private impact funds. See: NatureVest (an initiative of The Nature Conservancy) and EKO Asset Management Partners, 2014. Investing in Conservation: A landscape assessment of an emerging market. Available at: http://www.naturevesttnc.org/Reports/info.html. The NatureVest survey was path-breaking, but by its own account skewed to investors based in North America. ↩
Institutional or philanthropic investors such as those seeking to reduce poverty or mitigate GHG emissions would typically provide first-loss equity, start-up capital and capacity-building. Impact investors would provide preferred equity, and private institutional investors more generally would provide protected debt equity. Publicly funded institutional investors may be able to leverage private capital on a multiple of 4 to 5 for even smallholder investments basis by accepting as low as a 20–25% first loss for being the junior equity partner in a stacked capital deal. This implies that the first 20–25% of overall losses are absorbed by the first-loss investors, with a real chance that they will lose all their money before any of the other investors need to share in the loss. The preferred equity investor is next in line for losses and right behind debt investors for benefits. The debt investor is paid first and is last in line to lose its stake, but has a fixed and generally lower return. ↩
UN-REDD Programme, 2010. Frequently Asked Questions and Answers–The UN-REDD Programme and REDD+. Available at: http://www.unep.org/forests/Portals/142/docs/UN-REDD%20FAQs%20[11.10].pdf. ↩
Forest Carbon Partnership Facility (FCPF) Dashboard. 30 April 2015. Available at: http://forestcarbonpartnership.org/sites/fcp/files/2015/May/FCPF%20Readiness%20Progress__051515.pdf. ↩
Höhne, N., Bals, C., Röser, F., Weischer, L., Hagemann, M., El Alaoui, A., Eckstein, D., Thomä, J. and Rossé, M., 2015. Developing Criteria to Align Investments with 2°C Compatible Pathways. Prepared for the German Federal Environment Agency (UBA). NewClimate Institute, Germanwatch and 2° Investing Initiative. Available at: http://newclimate.org/2015/06/09/developing-criteria-to-align-investments-with-2c-compatible-pathways/. ↩
Norad, 2014. Real-Time Evaluation of Norway’s International Climate and Forest Initiative. Synthesising Report 2007–2013. Norad, Oslo. Available at: http://www.oecd.org/derec/norway/Real-Time-Evaluation-of-Norway-International-Climate-and-Forest-Initiative-Synthesising-Report-2007-2013.pdf. ↩
Liebreich, M., 2015. State of the Industry Keynote. Presented at the Bloomberg New Energy Finance Annual Summit, New York, 14 April. Available at: http://about.bnef.com/presentations/liebreich-state-industry-keynote/. See also: Randall, T., 2015. Fossil Fuels Just Lost the Race Against Renewables. Bloomberg, 14 April. Available at: http://www.bloomberg.com/news/articles/2015-04-14/fossil-fuels-just-lost-the-race-against-renewables.↩
Climate Bonds Initiative, 2014. History: Explosive growth in green bonds market. Available at: http://www.climatebonds.net/market/history.↩
IEA, 2014. World Energy Outlook 2014. International Energy Agency, Paris. Available at: http://www.worldenergyoutlook.org/publications/weo-2014.↩
IEA, n.d. World energy outlook, Modern energy for all. International Energy Agency, Paris. Available at: http://www.worldenergyoutlook.org/resources/energydevelopment. [Accessed 19 June 2015]↩
WHO, 2014. 7 million premature deaths annually linked to air pollution. 25 March. World Health Organization. Available at: http://www.who.int/mediacentre/news/releases/2014/air-pollution/en/.↩
See, e.g., Klevnäs, P., Stern, N. and Frejova, J., 2015. Oil Prices and the New Climate Economy. New Climate Economy briefing paper. Global Commission on the Economy and Climate and Stockholm Environment Institute, Stockholm. Available at: http://newclimateeconomy.report/2015/misc/working-papers/.↩
IEA, 2014. World Energy Outlook 2014. Paris. Available at: http://www.worldenergyoutlook.org/publications/weo-2014.
New Climate Economy, 2014. Better Growth, Better Climate: New Climate Economy Report. Available at: http://newclimateeconomy.report/2015.↩
IEA, 2014. World Energy Investment Outlook: Special Report. Paris. Available at: http://www.iea.org/publications/freepublications/publication/WEIO2014.pdf.↩
IEA, 2014. World Energy Investment Outlook. International Energy Agency, Paris. Investment targets for 2030 were estimated based on current investment levels and IEA’s estimate of total investment needs over the period 2014–2035.↩
The IEA uses a slightly different definition of clean energy investment, including transport energy efficiency and biofuels. With this definition, clean energy investments in the IEA’s 450 Scenario are US$0.9 trillion in 2020 and US$1.8 trillion in 2030. See: IEA, 2014. World Energy Outlook 2014 (p.93).↩
See: IRENA, 2015. Renewable Power Generation Costs in 2014. International Renewable Energy Agency, Abu Dhabi. Available at: http://www.irena.org/menu/index.aspx?mnu=Subcat&PriMenuID=36&CatID=141&SubcatID=494.
For a detailed discussion, see also Klevnäs et al., 2015. Oil Prices and the New Climate Economy, and Chapter 4 of Better Growth, Better Climate.↩
McCrone, A., Moslener, U., Usher, E., Grüning, C. and Sonntag-O’Brien, V. (eds.), 2015. Global Trends in Renewable Energy Investment 2015. Frankfurt School-UNEP Collaborating Centre for Climate & Sustainable Energy Finance, United Nations Environment Programme, and Bloomberg New Energy Finance. http://fs-unep-centre.org/publications/global-trends-renewable-energy-investment-2015.↩
Smith, N., 2015. Clean Energy Revolution is Ahead of Schedule. Bloomberg View, 8 April. Available at: http://www.bloombergview.com/articles/2015-04-08/clean-energy-revolution-is-way-ahead-of-schedule.↩
Alliance for Rural Electrification, 2013. Using Batteries to Ensure Clean, Reliable and Affordable Universal Electricity Access: A Guide for Energy Decision-makers. Available at: http://www.ruralelec.org/fileadmin/DATA/Documents/06_Publications/Position_papers/2013-06-11_ARE_Energy_Storage_Position_Paper_2013_FINAL.pdf.↩
Natural gas can provide substantial air quality and GHG benefits when replacing coal in the power sector, but is still a fossil fuel with significant risk of locking in long-term carbon emissions. For a detailed discussion, see: Lazarus, M., Tempest, K., Klevnäs, P. and Korsbakken, J. I., 2015. Natural Gas: Guardrails for a Potential Climate Bridge. New Climate Economy contributing paper. Stockholm Environment Institute, Stockholm and Seattle, WA, US. Available at: http://newclimateeconomy.report/2015/misc/working-papers/.↩
McCrone et al., 2015. Global Trends in Renewable Energy Investment 2015.↩
For examples of supportive measures in the domestic arena, see: OECD, 2015. Policy Guidance for Investment in Clean Energy Infrastructure: Expanding Access to Clean Energy for Green Growth and Development. Organisation for Economic Co-operation and Development, Paris. Available at: http://dx.doi.org/10.1787/9789264212664-en.
OECD, 2015. Overcoming Barriers to International Investment in Clean Energy, Green Finance and Investment. Organisation for Economic Co-operation and Development, Paris. Available at: http://dx.doi.org/10.1787/9789264227064-en.↩
Nelson, D., 2014. Roadmap to a Low Carbon Electricity System in the U.S. and Europe. Climate Policy Initiative, London. Available at: http://climatepolicyinitiative.org/publication/roadmap-to-a-low-carbon-electricity-system-in-the-u-s-and-europe/.↩
Global Commission on the Economy and Climate, 2014. Better Growth, Better Climate: The New Climate Economy Report. The Global Report. Washington, DC. Available at: http://newclimateeconomy.report/2015.↩
YieldCos are publicly traded companies paying dividends to shareholders from portfolios of owned renewable energy projects. For a detailed discussions, see Nelson, D., 2014. Roadmap to a Low Carbon Electricity System in the U.S. and Europe.↩
Climate Bonds Initiative, 2014. History: Exploding Growth in Green Bonds Market. Available at: http://www.climatebonds.net/market/history.
Berger, L., 2014. What You Need to Know About How Clean Energy YieldCos Work. Greentech Media, 10 July. Available at: http://www.greentechmedia.com/articles/read/what-you-need-to-know-about-how-yieldcos-for-clean-energy-work.↩
See IMF, 2015. From Billions to Trillions: Mobilising Development Finance. International Monetary Fund. Press release, April 2015. Available at: http://www.imf.org/external/np/sec/pr/2015/pr15170.htm
See also World Bank. Financing the post-2015 Development Agenda. April 2015. Available at: http://www.worldbank.org/mdgs/post2015.html↩
CPI, 2014. The Global Landscape of Climate Finance 2014. Climate Policy Initiative, San Francisco. Available at: http://climatepolicyinitiative.org/publication/global-landscape-of-climate-finance-2014/. Note that this total includes funding for adaptation, transport, and other climate-related investments not within the scope of this section.↩
Multilateral Development Banks, 2013. Joint Report on MDB Climate Finance 2013. Available at: http://www.afdb.org/fileadmin/uploads/afdb/Documents/Publications/Joint_Report_on_MDB_Climate_Finance_2013_-_16_09_2014.pdf.↩
BNEF, 2013. Development Banks: Breaking the US$100 billion a year barrier. Bloomberg New Energy Finance, New York. Available at: http://about.bnef.com/white-papers/development-banks-breaking-the-100bn-a-year-barrier/.↩
Morris, S. and Gleave, M., 2015. The World Bank at 75. CGD Policy Paper 058. Center for Global Development, Washington, DC. Available at: http://www.cgdev.org/publication/world-bank-75.↩
Humphrey, C., forthcoming. Challenges and Opportunities for Multilateral Development Banks in 21st Century Infrastructure Finance, (Forthcoming). Global Green Growth Institute and G24 special paper series on infrastructure finance and development. Global Green Growth Institute, Seoul.↩
For an estimate of global infrastructure investment needs, see McKinsey Global Institute, 2013. Infrastructure Productivity: How to Save $1 Trillion a Year. McKinsey & Company. Available at: file:///C:/Users/Michael/Downloads/MGI_Infrastructure_Full_report_Jan2013.pdf↩
IDFC, 2015. Development Banks Adopt Common Standards to Move Climate Finance Forward. Press release, 31 March. International Development Finance Club, Paris. Available at: https://www.idfc.org/Downloads/Press/02_general/Press_Release_Conclusion_IDFC%20Climate_EN.pdf.↩
See: http://climatefinancelab.org.↩
Varadarajan, U., Nelson, D., Pierpont, B. and Hervé-Mignucci, M., 2011. The Impacts of Policy on the Financing of Renewable Projects: A Case Study Analysis. Climate Policy Initiative, San Francisco, CA. Available at: http://climatepolicyinitiative.org/publication/the-impacts-of-policy-on-the-financing-of-renewable-projects-a-case-study-analysis/.
See also UNDP, 2015. Derisking Renewable Energy Investment. United Nations Development Programme. Available at: http://www.undp.org/drei.↩
Hogarth, J.R. and Granoff, I., 2015. Speaking Truth to Power: Why Energy Distribution, More than Generation, is Africa’s Poverty Reduction Challenge, Overseas Development Institute, London. Available at: http://www.odi.org/publications/9406-truth-power-energy-poverty-ambition-Africa.↩
See: UNEP, 2015. Increasing Private Capital Investment into Energy Access: The Case for Mini-Grid Pooling Facilities. United Nations Development Programme, Nairobi. Available at: http://apps.unep.org/publications/index.php?option=com_pub&task=download&file=011541_en.↩
Africa Progress Panel, 2015. Power, People, Planet: Seizing Africa’s Energy and Climate Opportunities. Africa Progress Report 2015. Geneva. Available at: http://app-cdn.acwupload.co.uk/wp-content/uploads/2015/06/APP_REPORT_2015_FINAL_low1.pdf.↩
Global Commission on the Economy and Climate, 2014. Better Growth, Better Climate: The New Climate Economy Report. The Global Report. Washington, DC. Available at: http://newclimateeconomy.report/2015.↩
See, e.g., IEA, 2014. Energy Efficiency Market Report 2014 – Market Trends and Medium-Term Prospects. International Energy Agency, Paris. Available at: http://www.iea.org/bookshop/463-Energy_Efficiency_Market_Report_2014.↩
Copenhagen Centre on Energy Efficiency, n.d. Resources. Available at: http://www.energyefficiencycentre.org/Resources. [accessed 5 June 2015].↩
G20, 2014. G20 Energy Efficiency Action Plan: Voluntary Collaboration on Energy Efficiency. Available at: https://g20.org/wp-content/uploads/2014/12/g20_energy_efficiency_action_plan.pdf.↩
Analysis based on data from: OICA, n.d. Production Statistics. Organisation Internationale des Constructeurs d’Automobiles. Available at: http://www.oica.net/category/production-statistics/. [accessed 22 May 2015].↩
IEA, 2014. Capturing the Multiple Benefits of Energy Efficiency. International Energy Agency, Paris. Available at: http://www.iea.org/bookshop/475-Capturing_the_Multiple_Benefits_of_Energy_Efficiency. The figures here are based on a net present value calculation.↩
IEA, 2014. Capturing the Multiple Benefits of Energy Efficiency.↩
IEA, 2013. Energy Efficiency Market Report 2013 – Market Trends and Medium-Term Prospects. International Energy Agency, Paris. Available at: https://www.iea.org/publications/freepublications/publication/energy-efficiency-market-report-2013.html.↩
Klevnäs, P., Stern, N. and Frejova, J. 2015. Oil Prices and the New Climate Economy. New Climate Economy briefing paper. Global Commission on the Economy and Climate and Stockholm Environment Institute, Available at: http://newclimateeconomy.report/2015/misc/working-papers/.↩
IEA, 2014. World Energy Outlook 2014. International Energy Agency, Paris. Available at: http://www.worldenergyoutlook.org/publications/weo-2014/.↩
IEA, 2015. Energy Technology Perspectives 2015: Mobilising Innovation to Accelerate Climate Action. International Energy Agency, Paris. Available at: http://dx.doi.org/10.1787/energy_tech-2015-en.↩
IEA, 2015. Energy Technology Perspectives 2015.↩
IEA, 2014. Capturing the Multiple Benefits of Energy Efficiency.↩
IEA, 2011. 25 Energy Efficiency Policy Recommendations – 2011 Update. International Energy Agency, Paris. Available at: https://www.iea.org/publications/freepublications/publication/25-energy-efficiency-policy-recommendations—2011-update.html.↩
A global assessment of energy productivity found the top-performing countries were Hong Kong, Colombia and Singapore. See: Ecofys, 2015. The 2015 Energy Productivity and Economic Prosperity Index. How Efficiency Will Drive Growth, Create Jobs and Spread Wellbeing Throughout Society. Available at: http://www.ecofys.com/files/files/the-2015-energy-productivity-and-economic-prosperity-index.pdf.↩
There is a particularly strong case for convergence around testing and measurement standards, in order to minimise the regulatory burden on businesses in meeting differing requirements in different jurisdictions.↩
See: https://www.energystar.gov.↩
Kimuna, O., 2009. Japanese Top Runner Approach for Energy Efficiency Standards, SERC Discussion Paper 09035. Available at: http://criepi.denken.or.jp/jp/serc/discussion/09035.html.↩
The World Bank, 2011. Energy Efficiency: Lessons Learned from Success Stories. Washington, DC. Available at: https://openknowledge.worldbank.org/handle/10986/12236.↩
This excludes standards in electricity production where further savings are possible. For example, the UK has implemented standards on electricity production to improve efficiency.↩
There are no carbon pricing schemes in place with rules that automatically increase the carbon price over time.↩
To be fully effective, a carbon price needs to be part of a well-aligned and integrated package of policies for market failures that hold back low-carbon investment and change.
See: OECD, 2015. Aligning Policies for a Low-Carbon Economy. Produced in cooperation with the International Energy Agency, International Transport Forum, and Nuclear Energy Agency. Organisation for Economic Co-operation and Development, Paris. Available at: http://dx.doi.org/10.1787/9789264233294-en.
Also see: Global Commission on the Economy and Climate, 2014. Better Growth, Better Climate: The New Climate Economy Report. The Global Report. Washington, DC. Available at: http://newclimateeconomy.report/2015.↩
The World Bank, 2015. Carbon Pricing Watch 2015: An advance brief from the State and Trends of Carbon Pricing 2015 report, to be released late 2015. Washington, DC. Available at: http://documents.worldbank.org/curated/en/2015/05/24528977/carbon-pricing-watch-2015-advance-brief-state-trends-carbon-pricing-2015-report-released-late-2015.↩
For a survey and analysis of the structure and level of energy taxes in OECD and selected other countries, see: OECD, 2015. Taxing Energy Use 2015: OECD and Selected Partner Economies. Organisation for Economic Co-operation and Development. Available at: http://dx.doi.org/10.1787/9789264232334-en.↩
The World Bank, 2015. Carbon Pricing Watch 2015.↩
For example, see the 29 May 2015 letter to the United Nations Framework Convention on Climate Change (UNFCCC) Secretariat and the COP21 Presidency: http://s08.static-shell.com/content/dam/shell-new/local/corporate/corporate/downloads/pdf/media/speeches/2015/letter-to-unfccc.pdf.↩
Support for carbon pricing is being expressed publicly in a variety of ways. Ahead of the UN Climate Summit in September 2014, 73 countries, 22 sub-national jurisdictions and more than 1,000 companies and investors expressed their support for a price on carbon. See: The World Bank, 2014. 73 Countries and Over 1,000 Businesses Speak Out in Support of a Price on Carbon. 22 September. Available at: http://www.worldbank.org/en/news/feature/2014/09/22/governments-businesses-support-carbon-pricing. In addition, more than 360 investors, representing over US$24 trillion in assets, called on governments to commit to “provide stable, reliable and economically meaningful carbon pricing that helps redirect investment commensurate with the scale of the climate change challenge”. See: Global Investor Statement on Climate Change, 2014. Available at: http://investorsonclimatechange.org/.↩
Business & Climate Summit 2015. Business & Climate Summit conclusions: towards a low-carbon society. Press release, 21 May. Paris. Available at: http://www.businessclimatesummit.com/press-room/↩
CDP, 2014. Global Corporate Use of Carbon Pricing: Disclosures to Investors. New York. Available at: https://www.cdp.net/CDPResults/global-price-on-carbon-report-2014.pdf.↩
CDP, 2014. Global Corporate Use of Carbon Pricing: Disclosures to Investors.↩
See Part II, Enabling a low-carbon transition: prices and more, in: Fay, M., Hallegatte, S., Vogt-Schilb, A., Rozenberg, J., Narloch, U., and Kerr, T., 2015. Decarbonizing Development: Three Steps to a Zero-Carbon Future. The World Bank, Washington, DC. Available at: http://hdl.handle.net/10986/21842.↩
European Commission, n.d. Auctioning. Available at: http://ec.europa.eu/clima/policies/ets/cap/auctioning/index_en.htm. [Accessed 15 June 2015].↩
Fairfield, N., 2014. Best of Both Worlds? Northeast Cut Emissions and Enjoyed Growth. The New York Times. 6 June. Available at: http://www.nytimes.com/2014/06/06/upshot/best-of-both-worlds-northeast-cut-emissions-and-enjoyed-growth.html. ↩
Elgie, S. and McClay, J., 2013. BC’s carbon tax shift is working well after four years. Canadian Public Policy, 39 (Supplement 2). 1–10. DOI:10.3138/CPP.39.Supplement2.S1.↩
IEA, 2014, World Energy Outlook 2014.↩
This is the estimated range for 2005–2011. See: OECD, 2013. Inventory of Estimated Budgetary Support and Tax Expenditures for Fossil Fuels 2013. Organisation for Economic Co-operation and Development, Paris. Available at: http://dx.doi.org/10.1787/9789264187610-en.↩
Clements, B.J., Coady, D., Fabrizio, S., Gupta, S., and Serge, T., 2013. Energy Subsidy Reform: Lessons and Implications. International Monetary Fund, Washington, DC. Available at: http://www.elibrary.imf.org/page/energysubsidylessons.↩
The World Bank, 2014. Transitional Policies to Assist the Poor While Phasing Out Inefficient Fossil Fuel Subsidies that Encourage Wasteful Consumption. Contribution by the World Bank to G20 Finance Ministers and Central Bank Governors, September. Available at: http://www.oecd.org/site/tadffss/reports-to-g20-fossil-fuel-subsidies.htm.↩
Lower oil prices have led to stronger calls from industry to increase fossil fuel production subsidies, e.g. in the UK.↩
Klevnäs, P., Stern, N., and Frejova, J., 2015. Oil Prices and the New Climate Economy. New Climate Economy briefing paper. Global Commission on the Economy and Climate and Stockholm Environment Institute. Available at: http://newclimateeconomy.report/2015/misc/working-papers/.↩
See: G20, 2013. G20 Leaders’ Declaration. St. Petersburg, Russia, September. Available at: https://g20.org/wp-content/uploads/2014/12/Saint_Petersburg_Declaration_ENG_0.pdf.
See also: G20, 2014. G20 Leaders’ Communiqué. Brisbane, Australia, 15–16 November. Available at: https://g20.org/wp-content/uploads/2014/12/brisbane_g20_leaders_summit_communique.pdf.↩
See: http://www.thepmr.org/content/supporting-action-climate-change-mitigation. [Accessed 15 June 2015].↩
See, e.g.: Holeywell, R., 2013. Houston: The Surprising Contender in America’s Urban Revival. Governing, October. Available at: http://www.governing.com/topics/urban/gov-houston-urban-revival.html.
Revkin, A. C., 2015. In Texas, the Race to Build in Harm’s Way Outpaces Flood-Risk Studies and Warming Impacts. The New York Times, 26 May. Dot Earth. Available at: http://dotearth.blogs.nytimes.com//2015/05/26/in-texas-the-race-to-develop-in-harms-way-outpaces-flood-risk-studies-and-warming-impacts/.
Egan, T., 2014. A Mudslide, Foretold. The New York Times, 29 March. Sunday Review. Available at: http://www.nytimes.com/2014/03/30/opinion/sunday/egan-at-home-when-the-earth-moves.html.↩
See, e.g.: ASCE, 2013. 2013 Report Card for America’s Infrastructure. American Society of Civil Engineers. Available at: http://www.infrastructurereportcard.org/.Llana, S. M., 2015. In precision-driven Germany, crumbling bridges and aging roads. Christian Science Monitor, 12 March. Available at: http://www.csmonitor.com/World/Europe/2015/0312/In-precision-driven-Germany-crumbling-bridges-and-aging-roads.↩
Global Commission on the Economy and Climate, 2014. Better Growth, Better Climate. See Synthesis Report or, for a more detailed discussion, Chapter 6.↩
See: G20, 2014. The G20 Global Infrastructure Initiative. Note prepared by the Australian Presidency. Available at: http://www.g20australia.org/sites/default/files/g20_resources/library/g20_note_global_infrastructure_initiative_hub.pdf.↩
See: http://www.worldbank.org/en/topic/publicprivatepartnerships/brief/global-infrastructure-facility.↩
See: http://www.afdb.org/en/topics-and-sectors/initiatives-partnerships/africa50-infrastructure-fund/background/.↩
See: http://www.aiibank.org.↩
See: VI Brics Summit, 2014. Agreement on the New Development Bank. Fortaleza, Brazil, 15 July. Available at: http://brics6.itamaraty.gov.br/media2/press-releases/219-agreement-on-the-new-development-bank-fortaleza-july-15.↩
Global Commission for the Economy and Climate, 2014. Better Growth, Better Climate. Synthesis Report, Figure 2.↩
Humphrey, C., 2014. Challenges and Opportunities for Multilateral Development Banks in 21st Century Infrastructure Finance. MARGGK Working Paper 8.↩
See https://www.idfc.org/Downloads/Press/02_general/Press_Release_Conclusion_IDFC%20Climate_EN.pdf.↩
G20 Australia, 2014. Report to the Finance Ministers. G20 Climate Finance Study Group, September. Available at: http://www.g20australia.org/sites/default/files/g20_resources/library/g20_climate_finance_study_group.pdf.↩
See, for example, the Focusing Capital on the Long-Term initiative led by McKinsey & Company: http://www.fclt.org.↩
OECD, IEA, ITF and NEA, 2015. Aligning Policies for a Low-Carbon Economy. Organisation for Economic Co-operation and Development, International Energy Agency, Nuclear Energy Agency, and International Transport Forum, Paris. Available at: http://www.oecd.org/environment/aligning-policies-for-a-low-carbon-economy-9789264233294-en.htm.↩
Varma, A., Whitely, S., Schmid, S., Le-Cornu, E., Dodwell, C., Holdaway, E., Agster, R., Steinbach, D. and Caravani, A., 2013. European and International Financial Institutions: Climate related standards and measures for assessing investments in infrastructure projects. Prepared for the European Commission – DG Climate Action, by Ricardo-AEA, Adelphi and the Overseas Development Institute. Available at: http://ec.europa.eu/clima/events/docs/0072/study_standards_mesures_en.pdf.
Cochran, I., Eschalier, C. and Deheza, M., 2015. Mainstreaming Low-Carbon Climate-Resilient Growth Pathways into Investment Decision-Making – Lessons from Development Financial Institutions on Approaches and Tools. The Association pour la promotion de la recherché sur l’économie du climate (APREC), Caisse de Dépôts (CDC) and Agence Française de Développement (AFD).
Höhne, N., Bals, C., Röser, F., Weischer, L., Hagemann, M., El Alaoui, A., Eckstein, D., Thomä, J. and Rossé, M., 2015. Developing Criteria to Align Investments with 2°C Compatible Pathways. Prepared for the German Federal Environment Agency (UBA). NewClimate Institute, Germanwatch and 2° Investing Initiative. Available at: http://newclimate.org/2015/06/09/developing-criteria-to-align-investments-with-2c-compatible-pathways/.↩
This framework was developed by Cochran et al., 2015. Mainstreaming Low-Carbon Climate-Resilient Growth Pathways into Investment Decision-Making.↩
See, e.g., OECD, 2010. The OECD Innovation Strategy: Getting a Head Start on Tomorrow. Organisation for Economic Co-operation and Development, Paris. Available at: http://www.oecd.org/sti/inno/theoecdinnovationstrategygettingaheadstartontomorrow.htm.↩
See Global Commission for the Economy and Climate, 2014. Better Growth, Better Climate, Chapter 7.↩
Ellen MacArthur Foundation, 2012. Towards a Circular Economy. Vol. 1. Cowes, Isle of Wight, UK. Available at: http://www.ellenmacarthurfoundation.org/business/reports/ce2012.↩
IEA, 2015. Participation of governments, private sector, international organisations and non-governmental organisations in IEA energy technology initiatives. International Energy Agency, Paris. Available at: http://www.iea.org/media/impag/CurrentparticipantsinallIAs.pdf.↩
See: http://www.cgiar.org/press-releases/cgiar-doubles-funding-to-1-billion-in-five-years/.↩
IEA, 2015. IEA Energy Technology RD&D Statistics. International Energy Agency, Paris. Available at: http://wds.iea.org/WDS/ReportFolders/ReportFolders.aspx.↩
See Global Commission for the Economy and Climate, 2014. Better Growth, Better Climate, Chapter 7, Figure 4.↩
Rhodes, A., Skea, J. and Hannon, M., 2014. The Global Surge in Energy Innovation. Energies, 7(9), 5601–5623. DOI:10.3390/en7095601.↩
Beintema, N., Stads, G.-J., Fuglie, K. and Heisey, P., 2012. ASTI Global Assessment of Agricultural R&D Spending. International Food Policy Research Institute, Washington, DC, and Global Forum on Agricultural Research, Rome. Available at: http://www.ifpri.org/publication/asti-global-assessmentagricultural-rd-spending.↩
Global Commission on the Economy and Climate, 2014. Better Growth, Better Climate, Chapter 7.↩
OECD, 2014. Measuring Environmental Innovation Using Patent Data: Policy Relevance. Environment Policy Committee, Organisation for Economic Co-operation and Development, Paris. Available at: http://www.oecd.org/officialdocuments/publicdisplaydocumentpdf/?cote=ENV/EPOC/WPEI%282014%296/FINAL&docLanguage=En.↩
McCrone, A., Moslener, U., Usher, E., Grüning, C. and Sonntag-O’Brien, V. (eds.), 2015. Global Trends in Renewable Energy Investment 2015. Frankfurt School-UNEP Collaborating Centre for Climate & Sustainable Energy Finance, United Nations Environment Programme, and Bloomberg New Energy Finance. http://fs-unep-centre.org/publications/global-trends-renewable-energy-investment-2015.↩
Hultman, N., Sierra, K., Eis, J. and Shapiro, A., 2012. Green Growth Innovation: New Pathways for International Cooperation. Brookings Institution, Washington DC. Available at: http://www.brookings.edu/research/reports/2012/11/green-growth-innovation.↩
IEA, 2015. Energy Technology Perspectives 2015: Mobilising Innovation to Accelerate Climate Action. International Energy Agency, Paris. Available at: http://dx.doi.org/10.1787/energy_tech-2015-en. See Part 1, Chapter 2: Tracking clean energy progress.↩
IPCC, 2014. Climate Change 2014: Mitigation of Climate Change. In Contribution of Working Group III to the Fifth Assessment Report of the Intergovernmental Panel on Climate Change. Available at: http://mitigation2014.org/.↩
IEA, 2015. Energy Technology Perspectives 2015.↩
IEA, 2015. Energy Technology Perspectives 2015.↩
IPCC, 2014. Climate Change 2014: Mitigation of Climate Change.↩
IEA, 2015. Energy Technology Perspectives 2015.↩
See: http://www.infodev.org/climate.↩
Treating the EU as a single “home country”.↩
OECD, 2014. Main Science and Technology Indicators Volume 2014 Issue 2. OECD Publishing, Paris. Available at: http://www.oecd-ilibrary.org/science-and-technology/main-science-and-technology-indicators/volume-2014/issue-2_msti-v2014-2-en.↩
National Science Board, 2014. Science and Engineering Indicators 2014. National Science Foundation, Arlington, VA. Available at: http://www.nsf.gov/statistics/seind14/content/etc/nsb1401.pdf.↩
These and similar approaches are discussed in the Global Commission on the Economy and Climate, 2014. Chapter 7: Innovation. See also The World Bank, 2008. Global Economic Prospects 2008. Technology Diffusion in the Developing World. Washington DC.↩
King, D. et al. 2015. A Global Apollo Program to Combat Climate Change. Available at: http://cep.lse.ac.uk/pubs/download/special/Global_Apollo_Programme_Report.pdf↩
These are the top 500 companies by market capitalisation. See: Thomson Reuters, 2014. Global 500 Greenhouse Gases Performance 2010–2013: 2014 Report on Trends. Available at: http://site.thomsonreuters.com/corporate/pdf/global-500-greenhouse-gases-performance-trends-2010-2013.pdf ↩
Business & Climate Summit, 2015. Conclusions: towards a low-carbon society. Press release. Available at: http://www.businessclimatesummit.com/wp-content/uploads/2015/05/Business-Climate-Summit-Press-release.pdf. ↩
UK Department for Business, Innovation & Skills, 2013. Low Carbon Environmental Goods and Services (LCEGS): Report for 2011/12. Available at: https://www.gov.uk/government/uploads/system/uploads/attachment_data/file/224068/bis-13-p143-low-carbon-and-environmental-goods-and-services-report-2011-12.pdf ↩
See, for example, the Cement Sustainability Initiative: http://www.wbcsdcement.org/index.php/en/key-issues/emissions-reduction.
Also the World Steel Association: http://www.worldsteel.org/publications/position-papers/Steel-s-contribution-to-a-low-carbon-future.html.
European Climate Foundation, 2014. Europe’s Low Carbon Transition: Understanding the Challenges and Opportunities for the Chemical Sector. Available at: http://europeanclimate.org/europes-low-carbon-transition-understanding-the-chemicals-sector/.↩
CDP (formerly the Carbon Disclosure Project) holds the world’s largest repository of publicly available environmental data and performance information from companies, cities and other emitting entities, gathered on behalf of 822 institutional investors, representing US$95 trillion of assets. CDP data is collected from companies, cities and others in over 80 countries.↩
CDP, 2015 (forthcoming). CDP Policy Briefing: Corporate Ambition and Action on Climate Change. Report prepared for the New Climate Economy. To be available at: http://www.cdp.net.↩
EEA, 2014. Annual European Union Greenhouse Gas Inventory 1990–2012 and Inventory Report 2014. European Environment Agency, Copenhagen. Available at: http://www.eea.europa.eu//publications/european-union-greenhouse-gas-inventory-2014. See Table ES.3, which shows France’s emissions in 2012 were 490.1 Mt CO2e, and the Netherlands’ were 191.7 Mt CO2e.↩
Ceres, 2014. Power Forward 2.0: How American Companies Are Setting Clean Energy Targets and Capturing Greater Business Value. Available at: http://www.ceres.org/resources/reports/power-forward-2.0-how-american-companies-are-setting-clean-energy-targets-and-capturing-greater-business-value/view.↩
For example, the average IRR for low-carbon energy installations was 6% in the EU, where it was the most common project type, 12% in the US, 10% in South Africa, and 20% in India. Measures to improve energy efficiency in industrial processes, meanwhile, had an average IRR of 19% in the EU, 81% in the US, 46% in South Africa, and 7% in India. Energy efficiency in buildings had negative returns in the EU and South Africa, -21% and -7%, respectively, but positive returns in the US and India, averaging 13%.
See: We Mean Business, 2014. The Climate Has Changed: Why Bold, Low Carbon Action Makes Good Business Sense. Report prepared by CDP. Available at: https://www.cdp.net/Documents/we-mean-business-the-climate-has-changed.pdf.↩
Ambec, S. and Lanoie, P., 2008. Does It Pay to Be Green? A Systematic Overview. The Academy of Management Perspectives, 22(4). 45–62. DOI:10.5465/AMP.2008.35590353.
Khan, M., Srafeim, G., and Yoon, A., 2015. Corporate Sustainability: First Evidence on Materiality. HBS Working Paper 15-073. Harvard Business School, Cambridge, MA, US. Available at: http://hbswk.hbs.edu/item/7755.html.↩
CDP, 2014. The A List: The CDP Climate Leadership Performance Index 2014. Available at: https://www.cdp.net/CDPResults/CDP-climate-performance-leadership-index-2014.pdf. Note that comparing the CDP index against a mainstream index entails differences in index size, sector weighting and regional allocation. This comparison has not been risk-weighted to capture these factors.↩
CDP, 2014. The A List (see p.14). The CDP Climate Leadership Index includes 187 major companies from around the world in 12 different sectors taking the strongest action on climate change.↩
Global Investor Coalition on Climate Change, 2013. Global Investor Survey on Climate Change: 3rd annual report on actions and progress. Available at: http://www.ceres.org/resources/reports/global-investor-survey-on-climate-change-2013/view.↩
CDP, 2015 (forthcoming). CDP Policy Briefing: Corporate Ambition and Action on Climate Change.↩
BP, 2015. Shareholder resolution. Available at: http://www.bp.com/en/global/corporate/investors/annual-general-meeting/notice-of-meeting/shareholder-resolution.html. [Accessed 23 April 2015.]↩
Carbon Trust, 2015. Titans or Titanics? Understanding the business response to climate change and resource scarcity. Carbon Trust. London. Available at: http://www.carbontrust.com/resources/reports/advice/titans-or-titanics.↩
Only 70% of the companies reporting to CDP’s climate change program in 2014 had set either an intensity or an absolute target with almost 400 companies setting both.The CDP sample of 2,345 responding companies, including 83% of the Global 500. See: CDP, 2015 (forthcoming). CDP Policy Briefing: Corporate Ambition and Action on Climate Change.↩
We Mean Business, 2014. The Climate Has Changed.↩
A recent analysis, based on data disclosed to CDP, notes that “No fewer than 81% of the world’s 500 largest companies reported in 2014 as having emission reduction or energy-specific targets”, but “most of those targets are not of a magnitude to meet the threat posed by climate change. Either they do not cover a meaningful percentage of the organization’s emissions, or they are insufficiently long-term, or they are simply not ambitious enough.”
See: CDP, 2015. Mind the Science. Report for the We Mean Business coalition, with contributions from WWF, the UN Global Compact and the World Resources Institute. Paris. See figure on p.7 for a detailed breakdown. Available at: https://www.cdp.net/Documents/technical/2015/mind-the-science-report-2015.pdf.↩
See: http://www.ghgprotocol.org.↩
CDP, World Resources Institute and WWF, 2015. Sectoral Decarbonization Approach (SDA): A Method for Setting Corporate Emission Reduction Targets in Line with Climate Science. Version 1, May 2015. A product of the Science Based Targets Initiative. Available at: http://sciencebasedtargets.org/wp-content/uploads/2015/05/Sectoral-Decarbonization-Approach-Report.pdf.
See also the Science Based Targets Initiative website: http://sciencebasedtargets.org.↩
See: http://there100.org.↩
Clark, G.L., Feiner, A. and Viehs, M., 2014. From the Stockholder to the Stakeholder: How Sustainability Can Drive Financial Outperformance. University of Oxford, Arabesque Partners. Available at: http://www.smithschool.ox.ac.uk/library/reports/SSEE_Arabesque_Paper_16Sept14.pdf
See also the UN Environment Programme Finance Initiative: http://www.unepfi.org and the Global Sustainable Investment Alliance: http://www.gsi-alliance.org.↩
See: http://montrealpledge.org.↩
See: http://unepfi.org/pdc/.↩
See: http://lctpi.wbcsdservers.org.↩
See: http://www.tfa2020.com.↩
See: http://www.cisl.cam.ac.uk/business-action/sustainable-finance/banking-environment-initiative/programme/soft-commodities/soft-commodities.↩
Climate-related initiatives in the oil and gas sector include:
The Climate Clean Air Coalition Oil & Gas Initiative: http://www.unep.org/ccac/Initiatives/CCACOilGasInitiative/tabid/794015/Default.aspx.
The Oil and Gas Climate Initiative: http://www.un.org/climatechange/summit/wp-content/uploads/sites/2/2014/07/INDUSTRY-oil-and-gas-climate-initiative_REV.pdf; see also this May 2015 press release: http://www.eni.com/en_IT/media/press-releases/2015/05/OGCI_tackles_improved_emissions_management_and_transition_to_lower_carbon_energy.shtml.
The World Bank Zero Flaring by 2030: http://www.worldbank.org/en/programs/zero-routine-flaring-by-2030.↩
See: http://www.fclt.org.↩
See: http://www.climatebonds.net.↩
See: http://www.wemeanbusinesscoalition.org. One of the coalition’s activities is to press for businesses to lobby governments in a transparent and accountable manner. See: http://www.wemeanbusinesscoalition.org/content/responsible-corporate-engagement-climate-policy.
See also: Metzger, E., Dagnet, Y., Putt del Pino, S., Morgan, J., Karbassi, L., Huusko, H., Castellanos Silveira, F., et al., 2013. Guide for Responsible Corporate Engagement in Climate Policy. A Caring for Climate Report UN Global Compact, United Nations Framework Convention on Climate Change, United Nations Environment Programme, World Resources Institute, CDP, WWF, Ceres and The Climate Group. Available at: http://www.wri.org/publication/guide-responsible-corporate-engagement-climate-policy.↩
UN Climate Summit, 2014. Economic Drivers: Global Investors Action Statement. New York. 23 September. Available at: http://www.un.org/climatechange/summit/wp-content/uploads/sites/2/2014/09/FINANCING-Global-Investors.pdf.↩
Aviation accounts for approximately 2% of global CO2 emissions from fossil fuel use. See: ICAO, 2013. ICAO Environmental Report 2013: Aviation and Climate Change. International Civil Aviation Organization, Montreal. Available at: http://cfapp.icao.int/Environmental-Report-2013/
Shipping accounts for approximately 3% of global CO2 emissions from fossil fuel use. See: IMO, 2014. Third IMO GHG Study 2014. International Maritime Organization, London. Available at: http://www.imo.org/OurWork/Environment/PollutionPrevention/AirPollution/Pages/Greenhouse-Gas-Studies-2014.aspx.
See also: IEA, 2014. CO2 Emissions From Fuel Combustion: Highlights 2014. International Energy Agency, Paris. Available at: https://www.iea.org/publications/freepublications/publication/co2-emissions-from-fuel-combustion-highlights-2014.html.
Sims, R., Schaeffer, R., Creutzig, F., Cruz-Núñez, X., D’Agosto, M., et al., 2014. Chapter 8: Transport. In Climate Change 2014: Mitigation of Climate Change. Contribution of Working Group III to the Fifth Assessment Report of the Intergovernmental Panel on Climate Change. O. Edenhofer, R. Pichs-Madruga, Y. Sokona, E. Farahani, S. Kadner, et al. (eds.). Cambridge University Press, Cambridge, UK, and New York. Available at: https://www.ipcc.ch/report/ar5/wg3/.
The IPCC (2014) and IEA (in CO2 Emissions from Fossil Fuel Use 2014) report slightly different percentages. The IPCC includes forestry and land use in its total GHG emissions figure, while the IMO and ICAO do not. The IEA figures only account for international activity, not domestic, and thus are lower than total global emissions from these two sectors. The IMO analysis combines IEA data on fuel use with separate, bottom-up data to arrive at its figures.
UNEP, 2011. Bridging the Emissions Gap: A UNEP Synthesis Report. United Nations Environment Programme, Nairobi. Available at: http://www.unep.org/pdf/UNEP_bridging_gap.pdf. The 10-32% range depends on the emission reductions achieved elsewhere, as well as the growth in emissions from international aviation and shipping.↩
The share of international activity was 65% in aviation in 2010, and 84% in shipping in 2012.
See: ICAO, 2013. ICAO Environmental Report 2013: Aviation and Climate Change. International Civil Aviation Organization, Montreal. Available at: http://cfapp.icao.int/Environmental-Report-2013/.
IMO, 2014. Third IMO GHG Study 2014. International Maritime Organization, London. Available at: http://www.imo.org/OurWork/Environment/PollutionPrevention/AirPollution/Pages/Greenhouse-Gas-Studies-2014.aspx.↩
ICCT, 2011. Reducing Greenhouse Gas Emissions from Ships. White Paper Number 11. International Council on Clean Transportation. Available at: http://www.theicct.org/reducing-ghg-emissions-ships.↩
ATAG, 2014. Aviation: Benefits Beyond Borders. Air Transport Action Group, Geneva. Available at: http://aviationbenefits.org/media/26786/ATAG__AviationBenefits2014_FULL_LowRes.pdf. (Data attributed to Oxford Economics.)↩
IATA, 2015. Fact Sheet: Industry Statistics. Updated June 2015. International Air Transport Association, Montreal. Available at: http://www.iata.org/pressroom/facts_figures/fact_sheets/Documents/fact-sheet-industry-facts.pdf.↩
ATAG, 2014. Aviation: Benefits Beyond Borders.↩
IPCC, 2014. Kahn Ribeiro, S., S. Kobayashi, M. Beuthe, J. Gasca, D. Greene, D. S. Lee, Y. Muromachi, P. J. Newton, S. Plotkin, D. Sperling, R. Wit, P. J. Zhou, 2007: Transport and its infrastructure. In Climate Change 2007: Mitigation. Contribution of Working Group III to the Fourth Assessment Report of the Intergovernmental Panel on Climate Change [B. Metz, O.R. Davidson, P.R. Bosch, R. Dave, L.A. Meyer (eds)], Cambridge University Press, Cambridge, United Kingdom and New York, NY, USA. Available at: http://www.ipcc.ch/pdf/assessment-report/ar4/wg3/ar4-wg3-chapter5.pdf
ICAO, 2013. ICAO Environmental Report 2013.
Moreover, when its non-CO2 impacts are factored-in, it contributes 4.9% of the Earth’s warming effect. Source: WWF and Vivid Economics, 2012. Aviation Report: Market Based Mechanisms to Curb Greenhouse Gas Emissions from International Aviation. Available at: http://awsassets.panda.org/downloads/aviation_main_report_web_simple.pdf.↩
ICAO, 2013. ICAO Environmental Report 2013.↩
ICAO, 2013. ICAO Environmental Report 2013.↩
Jardine, C.N., 2013. A Methodology for Offsetting Aviation Emissions. The Environmental Change Institute, University of Oxford. Available at: http://www.eci.ox.ac.uk/research/energy/downloads/aviation-climatecare.pdf.↩
European Commission, 2013. Evaluation of Directive 2009/12/EC on airport charges. Final Report. Available at: http://ec.europa.eu/transport/modes/air/studies/doc/airports/2013-09-evaluation-of-directive-2009-12-ec-on-airport-charges.pdf.
See also: IETA and EDF, 2013. Norway, The World’s Carbon Markets: A Case Study Guide to Emissions Trading. Updated May 2013. International Emissions Trading Association and Environmental Defense Fund. Available at: http://www.ieta.org/assets/Reports/EmissionsTradingAroundTheWorld/edf_ieta_norway_case_study_may_2013.pdf.
Keen, M., Parry, I., and Strand, J., 2013. Planes, Ships, and Taxes: Charging for International Aviation and Maritime Emissions. Economic Policy, 28(76). 701-749. DOI: 10.1111/1468-0327.12019.↩
United States Environmental Protection Agency (US EPA), 2015. Proposed Finding that Greenhouse Gas Emissions from Aircraft Cause or Contribute to Air Pollution that May Reasonably Be Anticipated to Endanger Public Health and Welfare and Advance Notice of Proposed Rulemaking. EPA-HQ-OAR-2014-0828. Available at: http://www.epa.gov/otaq/documents/aviation/aircraft-ghg-pr-anprm-2015-06-10.pdf.↩
European Union, 2009. Directive 2008/101/EC of the European Parliament and of the Council. Official Journal of the European Union. Available at: http://eur-lex.europa.eu/legal-content/EN/TXT/PDF/?uri=CELEX:32008L0101&from=EN.↩
Keen, M., Parry, I., and Strand, J., 2013. Planes, Ships, and Taxes: Charging for International Aviation and Maritime Emissions. Economic Policy, 28(76). 701-749. Available at: http://dx.doi.org/10.1111/1468-0327.12019.↩
Fuel costs’ share in 2014 and 2015 is projected to be lower, 26–28%, due to lower oil prices. See: IATA, 2014b. Fuel Fact Sheet, last updated December 2014. Available at: http://www.iata.org/pressroom/facts_figures/fact_sheets/documents/fuel-fact-sheet.pdf.↩
ICCT, 2014a. U.S. Domestic Airline Fuel Efficiency Ranking, 2013. White paper. ICCT, Washington, DC. Available at: http://www.theicct.org/sites/default/files/publications/ICCT_USairline-ranking_2013.pdf.↩
Karp, G., 2014. “Winglets go a long way to give airlines fuel savings.” Chicago Tribune. 4 March. Available at: http://articles.chicagotribune.com/2014-03-04/business/ct-airline-winglets-0302-biz-20140304_1_fuel-savings-jet-fuel-southwest-airlines.↩
European Federation for Transport and Environment, 2010. Grounded: How ICAO failed to tackle aviation and climate change and what should happen now. Available at: http://www.transportenvironment.org/sites/te/files/media/2010_09_icao_grounded.pdf.
The report states: “According to the provisions of Article 2.2 [of the Kyoto Protocol]: ‘Parties included in Annex I shall pursue limitation or reduction of emissions of greenhouse gases…from aviation and marine bunker fuels, working through the International Civil Aviation Organization and the International Maritime Organization, respectively’. Unlike other sectors, responsibility for cutting international aviation emissions was not given to individual countries (parties). Instead reductions should be achieved by Annex 1 Parties working through international bodies that regulate these modes of transport – ICAO for aviation and IMO for maritime transport.”↩
European Federation for Transport and Environment, 2010. Grounded: How ICAO failed to tackle aviation and climate change and what should happen now.
Bows-Larkin, A., 2014. All adrift: aviation, shipping, and climate change policy. Climate Policy. DOI: 10.1080/14693062.2014.965125. This analysis treats international aviation as an average country to create an emissions pathway that would meet 2°C, then compares it to projected emissions from international aviation.↩
UN Climate Summit, 2014. Transport Aviation Action Plan. Available at: http://www.un.org/climatechange/summit/wp-content/uploads/sites/2/2014/09/TRANSPORT-Aviation-Action-plan.pdf.↩
ICCT, 2014. Could ICAO’s CO2 Standard Not Actually Cover Any Aircraft? Yes, If Nobody’s Watching. 9 December. Available at: http://www.theicct.org/blogs/staff/could-icaos-co2-standard-not-cover-any-aircraft.↩
ICAO, 2013. ICAO Environmental Report 2013: Aviation and Climate Change.↩
ICAO, 2013. 38th ICAO Assembly meeting press release.↩
ICAO, 2013. Report on the Assessment of Market-based Measures, 2013, p.2-1. Available at: http://www.icao.int/Meetings/GLADs-2015/Documents/10018_cons_en.pdf↩
Hemmings, B., 2013. Global deal or no deal? Your free guide to the ICAO Assembly, Transport and Environment, Available at: http://www.transportenvironment.org/publications/global-deal-or-no-deal-your-free-guide-icao-assembly.↩
ICAO, 2013. Report of the Assessment of Market-based Measures. ICAO, Montreal. Available at: http://www.icao.int/Meetings/GLADs-2015/Documents/10018_cons_en.pdf.↩
ICAO, 2013. Report of the Assessment of Market-based Measures.↩
ICAO, 2013. Report of the Assessment of Market-based Measures.↩
ICAO, 2013. Report of the Assessment of Market-based Measures.↩
International Chamber of Shipping (ICS), n.d. Key Facts. Available at: http://www.ics-shipping.org/shipping-facts/key-facts. [Accessed 5 May 2015.]↩
United Nations Conference on Trade and Development (UNCTAD), 2014. Review of Maritime Transport 2014. Geneva. Available at: http://unctad.org/en/PublicationsLibrary/rmt2014_en.pdf.↩
For the 2012 figures, see: IMO, 2014. Third IMO GHG Study 2014.
For the 1996 figures, see: IMO, 2000. Study of Greenhouse Gas Emissions from Ships. Issue 2. March. Available at: http://cleantech.cnss.no/wp-content/uploads/2011/05/2000-IMO-Study-of-Greenhouse-Gas-Emissions-from-Ships.pdf.
Total CO2 emissions for 2012 are estimated at 34.5 Gt. See: Olivier, J. G. J., Janssens-Maenhout, G., Muntean, M. and Peters, J. A. H. W., 2013. Trends in Global CO2 Emissions: 2013 Report. PBL Netherlands Environmental Assessment Agency, The Hague. Available at: http://www.pbl.nl/en/publications/trends-in-global-co2-emissions-2013-report48.pdf.↩
IMO, 2014. Third IMO GHG Study 2014.↩
ICCT, 2014c. Another Look Into the Crystal Ball. 14 March. Available at: http://www.theicct.org/blogs/staff/another-look-crystal-ball-imo.↩
According to the IMO (2014), Third IMO GHG Study, an additional 15 MtCO2e come from refrigerant and air conditioning gases on ships.↩
IMO, 2014. Third IMO GHG Study 2014. The discrepancy is due to different estimation methods (top-down vs. bottom-up).↩
The remainder is marine diesel oil (MDO), with marginal usage of liquefied natural gas (LNG). See: IMO, 2014. Third IMO GHG Study 2014.↩
IMO, 2015. The Existing Shipping Fleet’s CO2 Efficiency. London.ICCT, 2013. Long-term Potential for Increased Shipping Efficiency through the Adoption of Industry-Leading Practices. White paper. ICCT, Washington, DC. Available at: http://www.theicct.org/sites/default/files/publications/ICCT_ShipEfficiency_20130723.pdf.↩
Smith, T., O’Keeffe, E., Aldous, L. and Agnolucci, P., 2013. Assessment of Shipping’s Efficiency Using Satellite AIS data. UCL Energy Institute. Available at: http://lowcarbonshipping.co.uk/files/ucl_admin/Smith_et_al__2013_World_fleet_efficiency.pdf.↩
Smith, T., O’Keeffe, E., Aldous, L. and Agnolucci, P., 2013. Assessment of Shipping’s Efficiency Using Satellite AIS data. UCL Energy Institute. Available at: http://lowcarbonshipping.co.uk/files/ucl_admin/Smith_et_al__2013_World_fleet_efficiency.pdf.↩
Seas at Risk, 2010. Going Slow to Reduce Emissions. Available at: http://www.seas-at-risk.org/images/pdf/GoingSlowToReduceEmissions_1.pdf.↩
Smith et al., 2013. Assessment of Shipping’s Efficiency Using Satellite AIS data.↩
Faber, J. and ‘t Hoen, M., 2015. Historical trends in ship design efficiency. CE Delft, Delft. Available at: http://www.transportenvironment.org/publications/study-historical-trends-ship-design-efficiency.↩
Actual efficiency gains can vary significantly based on ship type and operating conditions, and independent testing in realistic conditions is relatively rare. Savings and payback periods also fluctuate with the price of fuel.↩
ICCT, 2013. Long-term Potential for Increased Shipping Efficiency through the Adoption of Industry-Leading Practices.↩
Corbett, J.J., Winebrake, J.J., Comer, B., Green, E., 2011. Energy and GHG Emissions Savings Analysis of Fluoropolymer Foul Release Hull Coating. Energy and Environmental Research Associates, LLC. Available at: http://www.theengineer.co.uk/Journals/1/Files/2011/2/21/20110215b%20International%20Paint%20Report.pdf.
The incremental cost above traditional coatings is only US$180,000, which would make the payback period even shorter.↩
Stulgis, V., et al., 2014. Hidden Treasure: Financial Models for Retrofits. Carbon War Room, Washington. Available at: http://lowcarbonshipping.co.uk/files/ucl_admin/CWR_Shipping_Efficiency_Finance_Report.pdf.
Rehmatulla, N. and Smith, T., forthcoming. Barriers to energy efficiency in shipping: A triangulated approach to investigate the principal agent problem. Accepted to Energy Policy.
Maddox Consulting, 2012. Analysis of market barriers to cost effective GHG emission reductions in the maritime transport sector. Available at: http://ec.europa.eu/clima/policies/transport/shipping/docs/market_barriers_2012_en.pdf.↩
Carbon War Room and RightShip, n.d. Shipping Efficiency. Available at: http://www.shippingefficiency.org/. [Accessed 4 June 2015.]↩
Clean Shipping Index, n.d. About the Clean Shipping Index. Available at: http://www.cleanshippingindex.com/about/. [Accessed 5 May 2015.]↩
Stulgis, V., et al., 2014. Hidden Treasure: Financial Models for Retrofits.↩
IMO, 2010. Control of Greenhouse Gas Emissions from Ships Engaged in International Trade. Position Note. Available at: http://www.imo.org/OurWork/Environment/PollutionPrevention/AirPollution/Documents/COP%2016%20Submissions/IMO%20note%20COP%2016.pdf.↩
The EEDI applies to the majority of new ships, but not all. Ships with less than 400 gross tonnage are also exempt. The ships covered by the EEDI represent approximately 85% of the CO2 emissions from international shipping. For more information, see: IMO, n.d. Energy Efficiency Measures. Available at: http://www.imo.org/OurWork/Environment/PollutionPrevention/AirPollution/Pages/Technical-and-Operational-Measures.aspx.↩
Marine Environment Protection Committee of the International Maritime Organization, 2012. 2012 Guidelines for the Development of a Ship Energy Efficiency Management Plan (SEEMP). Annex 9, Resolution MEPC.213(63). Available at: http://www.imo.org/KnowledgeCentre/IndexofIMOResolutions/Documents/MEPC%20-%20Marine%20Environment%20Protection/213%2863%29.pdf.↩
Bazari and Longva, 2011. Assessment of IMO Mandated Energy Efficiency Measures for International Shipping.
IMO Secretariat, 2011. UNFCCC Subsidiary Body for Scientific and Technical Advice (SBSTA 35). Agenda item 9(a) – Emissions from fuel used for international aviation and maritime transport. Durban. Available at: http://www.imo.org/OurWork/Environment/PollutionPrevention/AirPollution/Documents/COP%2017/Statements/IMO%20SBSTA%2035%20As%20delivered%2029.11.11.pdf.↩
IMO, 2014. Third IMO GHG Study 2014.↩
Marine Environment Protection Committee (MEPC), 2015. Reduction of GHG Emissions from Ships: Setting a reduction target and agreeing associated measures for international shipping. MEPC 68/5/1. Available at: http://www.lowcarbonshipping.co.uk/files/Ben_Howett/MEPC_68-5-1_-_Setting_a_reduction_target_and_agreeing_associated_measures_for_international_shipping_28Marshall_Islands29.pdf.↩
See: Velders, G. J. M., Ravishankara, A. R., Miller, M. K., Molina, M. J., Alcamo, J., Daniel, J. S., Fahey, D. W., Montzka, S. A. and Reimann, S., 2012. Preserving Montreal Protocol climate benefits by limiting HFCs. Science, 335. 922–923. DOI:10.1126/science.1216414.
See also: WMO, 2010. Scientific Assessment of Ozone Depletion: 2010. Global Ozone Research and Monitoring Project—Report No. 52. World Meteorological Organization. Available at: http://ozone.unep.org/new_site/en/scientific_assessment_2010.php.↩
Myhre, G., Shindell, D., Bréon, F.-M., Collins, W., Fuglestvedt, J. et al., 2013. Anthropogenic and natural radiative forcing. In Climate Change 2013: The Physical Science Basis. Contribution of Working Group I to the Fifth Assessment Report of the Intergovernmental Panel on Climate Change. T. F. Stocker, D. Qin, G.-K. Plattner, M. Tignor, S. K. Allen, et al. (eds.). Cambridge University Press, Cambridge, UK, and New York. Available at: https://www.ipcc.ch/report/ar5/wg1/.↩
New Climate Economy, 2015. Estimates of Emissions Reduction Potential for the 2015 Report: Technical Note. A technical note for Seizing the Global Opportunity: Partnerships for Better Growth and a Better Climate. Available at: http://newclimateeconomy.report/2015/misc/working-papers.↩
The Consumer Goods Forum, 2012. The CGF Good Practices About HFC-Free Refrigeration and Energy Efficiency. Available at: http://ausref.org.au/index.php/resources/downloads/category/7-engo-reports?download=17:cgf-refrigeration-progress-report.↩
Refrigerants, Naturally!, n.d. About Us. Available at: http://www.refrigerantsnaturally.com/about-us [Accessed 29 April 2015].↩
The numbers given are for HFCs’ 100-year global warming potential (GWP). The average GWP for HFCs currently used as substitutes for ODSs is 1,600, weighted by usage. See: Myhre et al., 2013. Anthropogenic and natural radiative forcing.↩
Velders, G. J. M., Solomon, S. and Daniel, J. S., 2014. Growth of climate change commitments from HFC banks and emissions. Atmospheric Chemistry and Physics, 14. 4563–4572. DOI:10.5194/acp-14-4563-2014.
See also: UNEP, 2011. HFCs: A Critical Link in Protecting Climate and the Ozone Layer. Synthesis Report, United Nations Environment Programme, Nairobi. Available at: http://www.unep.org/publications/contents/pub_details_search.asp?ID=6224.↩
Meek, K., 2015. Reducing HFCs in the US would benefit consumers and the climate. WRI blog. World Resources Institute, Washington, DC, 3 March. Available at: http://www.wri.org/blog/2015/03/reducing-hfcs-us-would-benefit-consumers-and-climate.↩
Carvalho, S., Andersen, S. O., Brack, D. and Sherman, N. J., 2014. Alternatives to High-GWP Hydrofluorocarbons. Institute for Governance & Sustainable Development. Available at: http://www.igsd.org/documents/HFCSharpeningReport.pdf.↩
See: Hydrocarbons 21, 2013. Heineken’s successful rollout of HC coolers- exclusive interview with Maarten ten Houten. 4 December. Available at: http://www.hydrocarbons21.com/news/viewprintable/4760.↩
See: The Coca-Cola Company, 2014. Coca-Cola Installs 1 Millionth HFC-Free Cooler Globally, Preventing 5.25MM Metric Tons of CO2. Press release, 22 January. Available at: http://www.coca-colacompany.com/innovation/coca-cola-installs-1-millionth-hfc-free-cooler-globally-preventing-525mm-metrics-tons-of-co2.↩
UNEP and CCAC, 2014. Low-GWP Alternatives in Commercial Refrigeration: Propane, CO2 and HFO Case Studies. United Nations Environment Programme and Climate and Clean Air Coalition to Reduce Short-Lived Climate Pollutants, Paris. Available at: http://www.unep.org/ccac/portals/50162/docs/Low-GWP_Alternatives_in_Commercial_Refrigeration-Case_Studies-Final.pdf.↩
UNEP, 2011. HFCs: A Critical Link in Protecting Climate and the Ozone Layer.↩
Velders et al., 2012. Preserving Montreal Protocol climate benefits by limiting HFCs.↩
US EPA, 2013. Global Mitigation of Non-CO2 Greenhouse Gases: 2010–2030. Section IV.2.3.3. US Environmental Protection Agency, Washington, DC. Available at: http://www.epa.gov/climatechange/Downloads/EPAactivities/MAC_Report_2013-IV_Industrial.pdf.↩
Shah, N., Wei, M. and Phadke, A., 2015. Energy Efficiency Benefits in Implementing Low Global Warming Potential Refrigerants in Air Conditioning – Some Preliminary Results. Presentation before the Open-Ended Working Group of the Montreal Protocol, Bangkok, Thailand, 23 April 2015. Available at: http://conf.montreal-protocol.org/meeting/oewg/oewg-35/pubs/SitePages/Home.aspx.↩
Phadke, A., Adhyankar, N. and Shah, N., 2013. Avoiding 100 New Power Plants by Increasing Efficiency of Room Air Conditioners in India: Opportunities and Challenges. Lawrence Berkeley National Laboratory. Available at: http://www.superefficient.org/en/Resources/~/media/Files/EEDAL%20Papers%20-%202013/031_Shah_finalpaper_EEDAL13.pdf.↩
US EPA, 2014. Benefits of Addressing HFCs under the Montreal Protocol. EPA 430-R-14-005. US Environmental Protection Agency, Washington, DC. Available at: http://www.epa.gov/ozone/downloads/Benefits_of_Addressing_HFCs_under_the_Montreal_Protocol-July2014MASTER_REV4.pdf.↩
Velders et al., 2012. Preserving Montreal Protocol climate benefits by limiting HFCs.↩
The CCAC has developed a guidance note to help countries identify specific actions on HFCs and other short-lived climate pollutants (SLCPs) that may be included in their INDCs. See: CCAC, 2015. Guidance Note on Short-Lived Climate Pollutants for Intended Nationally Determined Contributions. Climate and Clean Air Coalition to Reduce Short-Lived Climate Pollutants, Paris. Available at: http://www.ccacoalition.org/docs/pdf/Guidance_note_on_SLCPs_for_INDCs-16march2015.pdf.↩